
Stories of the Shortlist
We took a dive through the Showcase, and a picture began to emerge of the themes, viewpoints and events that captured the imagination of the dataviz community this year.
:: View the full 2019 Shortlist
Violence, War, & Crime
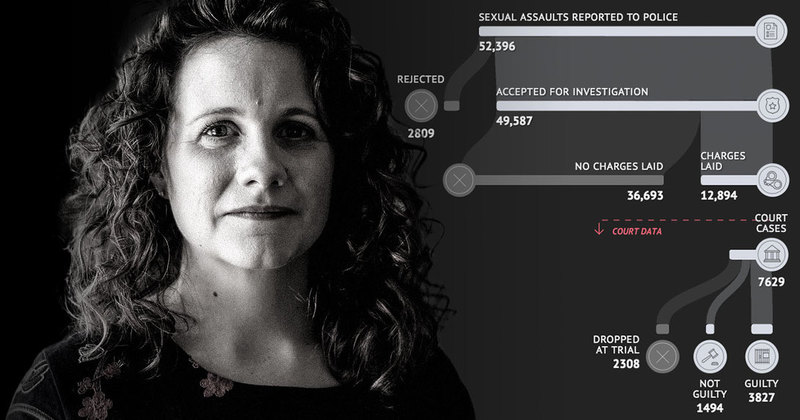
This year, data journalists uncovered stories from war-torn states, isolated detention centers, and neighborhoods affected by homicide. Everyday injustice and intimate violence were also major themes on the 2019 Shortlist, with reporters examining how police departments handle rape clearance, and highlighting racial bias in traffic stops.
Dataviz you can touch
With the explosion of apps, interactives, scrollytellings, and other digital innovations, it would seem that dataviz has fully embraced our online futures. That may be the case... but 2019 also saw many creatives push beyond those boundaries. The 2019 Shortlist features physical (and data-filled) representations of love, a massive installation of Starbucks' history, and a data tapestry. Print appears to be making a comeback in the form of a data-zine, an infographic children's book, and an exegesis of god's voice over the millenia. There are always new territories to explore in this field.

Water
The centrality of water to our planet's future popped up again and again this year. Our oceans are warming, plastic is proliferating, and the United States is experiencing freshwater stress. These visualizations prove the importance of water management to human life, connectivity, and trade... showing that our water resources are not to be taken for granted.
![]()
Migration
Human movement has been a constant throughout history. Data designers have visualized the impact of American immigration, 50 years of global ebb and flow across borders, and the mass migration that occured during German reunification. Migration is often tragically difficult for the people who move... as shown by the desperate crossings at the US/Mexico border and the number of deaths caused by European migration. But there is no evidence to show that undocumented immigrants increase crime in US communities.

Space
Not that we're in any danger of running out of data to visualize on Earth... but there are endless stories to tell about the skies above, should you find yourself in want of inspiration. Learn about the Soviet shuttle Buran, all of our missions to the moon, and the space junk that's been piling up there during the course of these explorations.

DIY Data
There are endless ways to collect & play with data. You can transform your own iris data into music. Or turn music into data. With all the data around us to work with, this year brought us fun tools and new methods to turn the numbers into fascinating charts and stories. Sometimes mistakes will be made... but that's part of the fun too.

:: See the 2019 Shortlist
Visualization & Information Design
:: See the 2018 Winners
Let the world know that you're on the Shortlist
Has your work made it through? Feel free to @-mention us on Twitter (@infobeautyaward), Facebook & Instagram - we'll try to RT and share as much as we can.

