Migration Waves by National Geographic
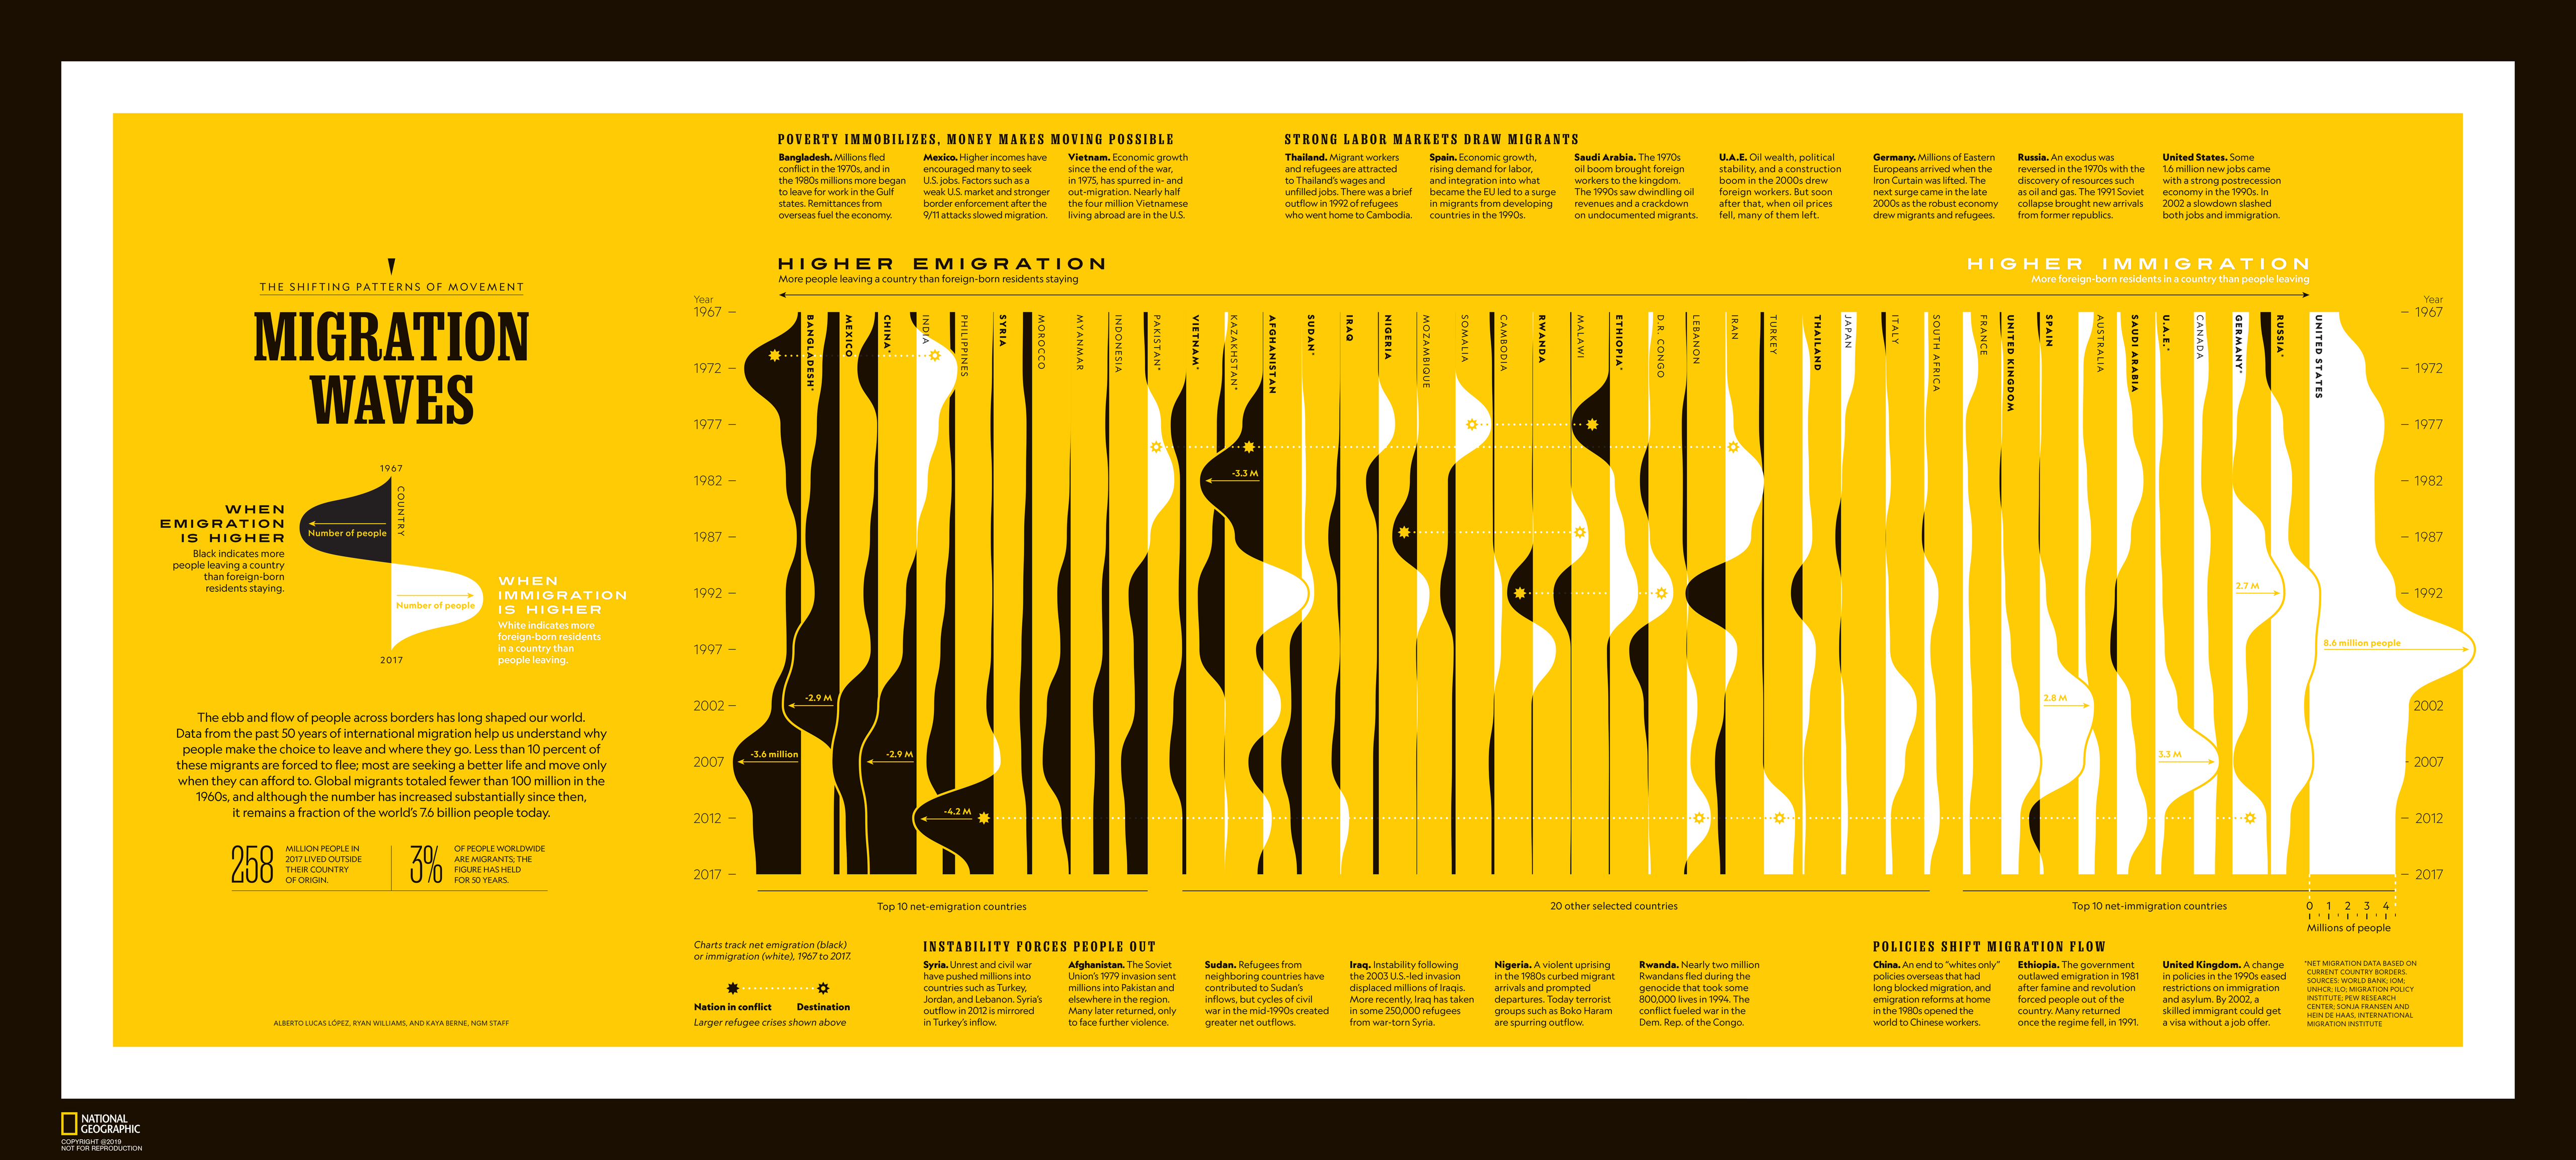
What does 50 years of human migration look like? The ebb and flow of people across borders has long shaped our world. Data from the past 50 years of international migration help us understand why people make the choice to leave and where they go. Less than 10 percent of these migrants are forced to flee; most are seeking a better life and move only when they can afford to. Global migrants totaled fewer than 100 million in the 1960s, and although the number has increased substantially since then, it remains a fraction of the world’s 7.6 billion people today.
The design of an infographic is functional, semantic, aesthetic, and even poetic.
This infographic is entitled "Migration Waves", the data has been represented with shapes that evoke sea waves on the NatGeo yellow background; creating with all this a direct connection to the cover where a migrant mother is hit by a wave whose picture is framed by the famous yellow rectangle.
Journalistic design = function, meaning, aesthetics and poetry.
The entrant has supplied multiple files for this work:
-
CreditsAlberto Lucas López, Ryan Williams and Kaya Berne
-
Award
-
Categories
-
See more


