
Food poisoning challenge - the winners
All the results are in for our food poisoning challenge!
We’re hugely excited to announce the following winners and runners-up, who will all be getting a cash prize for their sterling work.
And don’t despair if you missed out this time - we’ll be running a brand new challenge shortly. Make sure you’re kept in the loop by signing up to our monthly newsletter!
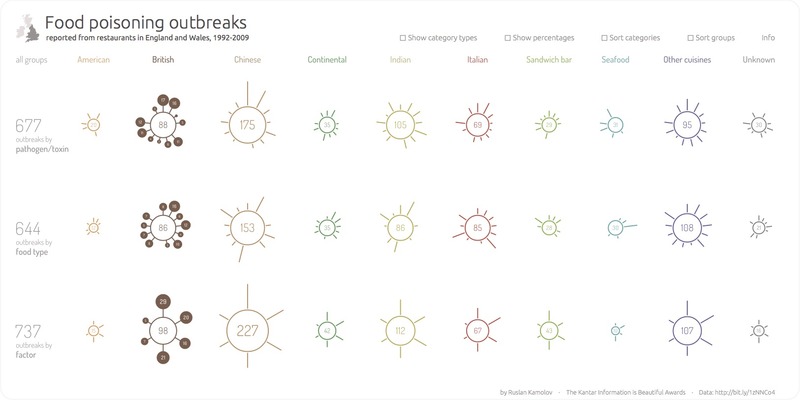
Interactive winner: Ruslan Kamolov ($2,000)
“Lovely simple design (with a bio/bug type vibe), a swathe of interactive sorting and filtering controls, and great attention to detail make this an inventive, infectious winner.” - David McCandless
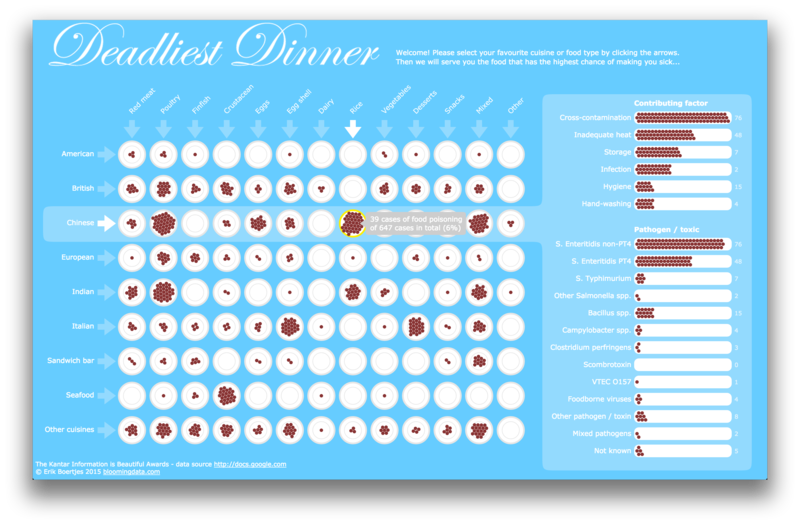
Interactive runner-up: Erik Boertjes ($750)
“Liked the rendering style and grid approach. And really lovely the additional layer of interactivity to personalise the data.”
Static winner: Andrew Park ($1,000)
"Andrew's entry was elegant and effective, revealing a distinct and clear breakdown of each dataset, alongside a strong visual approach and the use of several toilet pictograms! The final 'most lethal combination' was a crowning touch."

Static runner-up: Kelly Tall ($500)
"Kelly gave hers an academic approach which suited the scientific nature of the data. Her bubble charts are an easy, effective way to see the cartography of the data and to seek out patterns and interesting data points for yourself. Although, neatly, she added her own observations too."

Napkin winner: Janice Shiu ($500)
“A matrix approach works well for this type of data. Liked how Janice drilled down through each dataset to create a story. Really good ‘food’ colour choice as well.”

Napkin runner-up: Jim Roberts ($250)
“Enjoyed Jim's use of several visualization approaches (treemaps, bars, pictograms) to visualize the full width of this data in one big comparison chart.”


