A Long COVID Road Traveled by Amanda Anderson-You
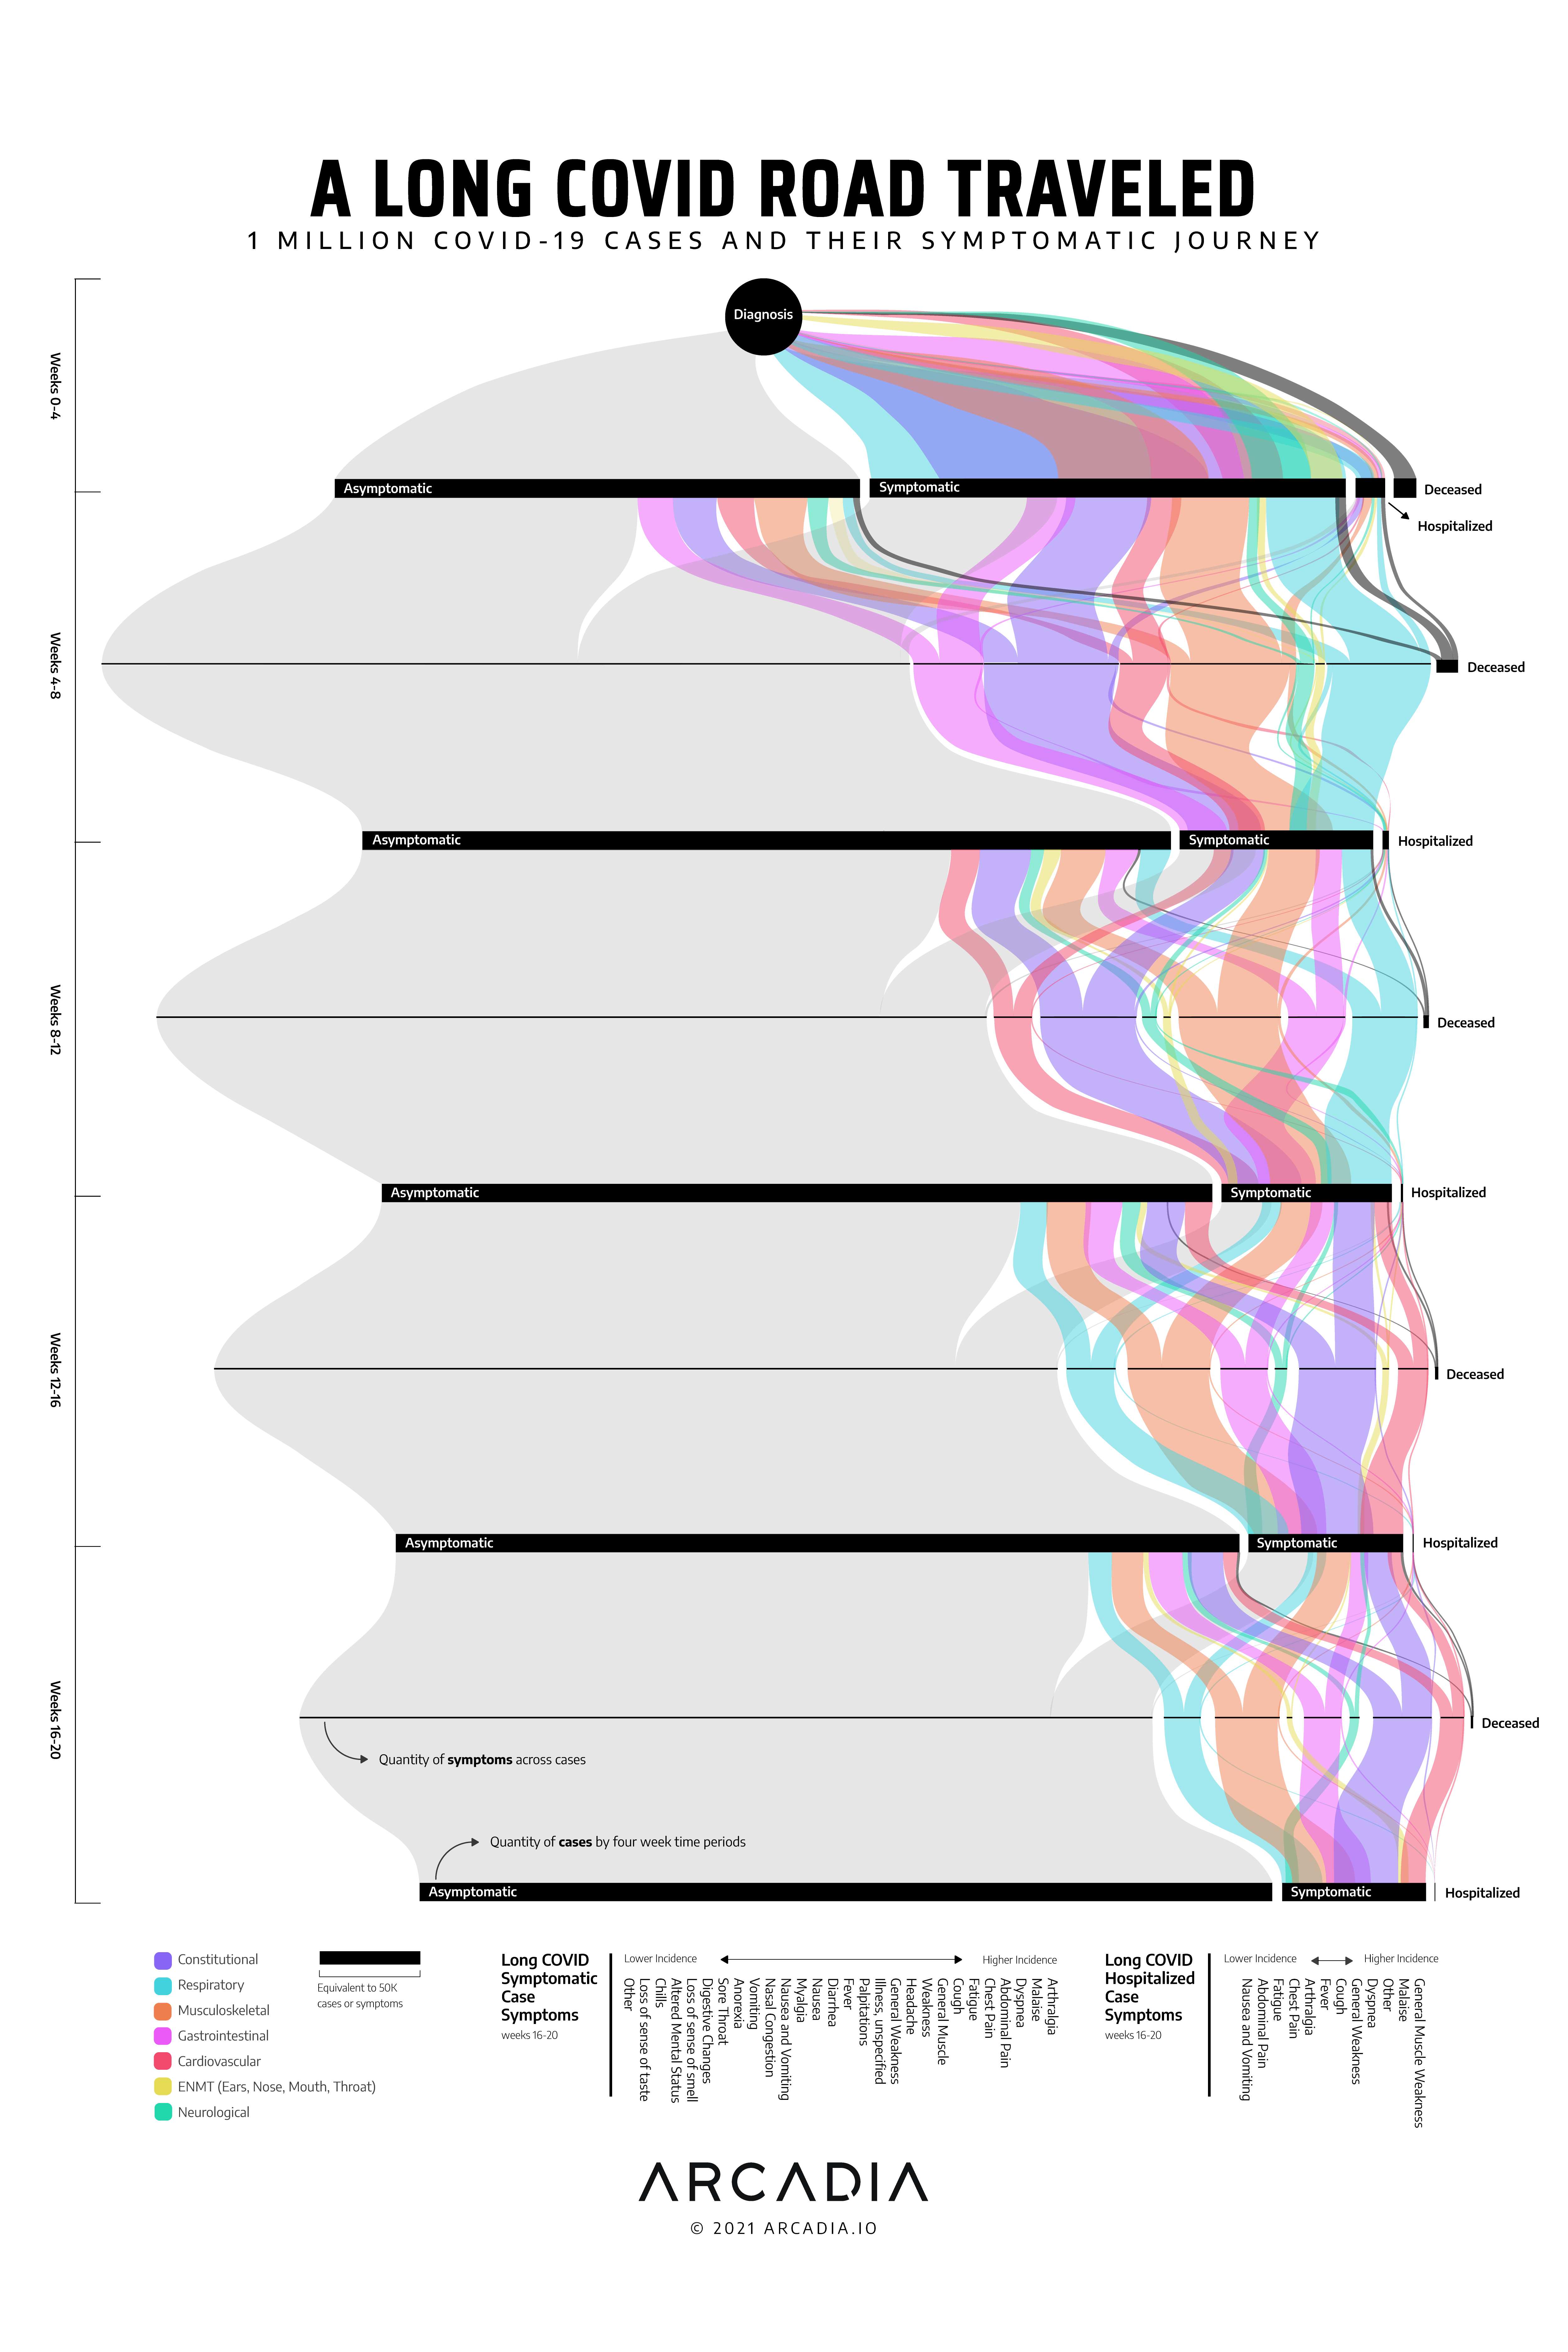
This visualization shows the symptomatic journey of 1 million COVID cases from diagnosis to the long COVID range of 16-20 weeks. At each 4 week juncture, a sankey treatment is used to show how case totals flow between asymptomatic, symptomatic, hospitalization, and sometimes resulting in death. The symptom totals are also shown for each time period, and symptom types are color coded by the seven different body systems as they relate. This visualization helps illustrate the fluctuations between case types throughout a 20 week timeline, and to see what body systems are most impacted as COVID symptoms persist into Long COVID.
I was commissioned by Arcadia.io to create this poster visualization to be displayed at the HIMSS conference in 2021. I partnered with their data scientists to obtain the data and analysis needed to complete this work.
-
CreditsMichael Simon, Director of Data Science at Arcadia.io Carole Masse, Brand/Content/Creative Director at Arcadia.io
-
Award
-
Categories
-
See more


