Not My Cup of Coffee by Cédric Scherer Data Visualization Design
A visualization of the distributions of coffee bean rating results per country, evaluated by the Coffee Quality Institute's trained reviewers.
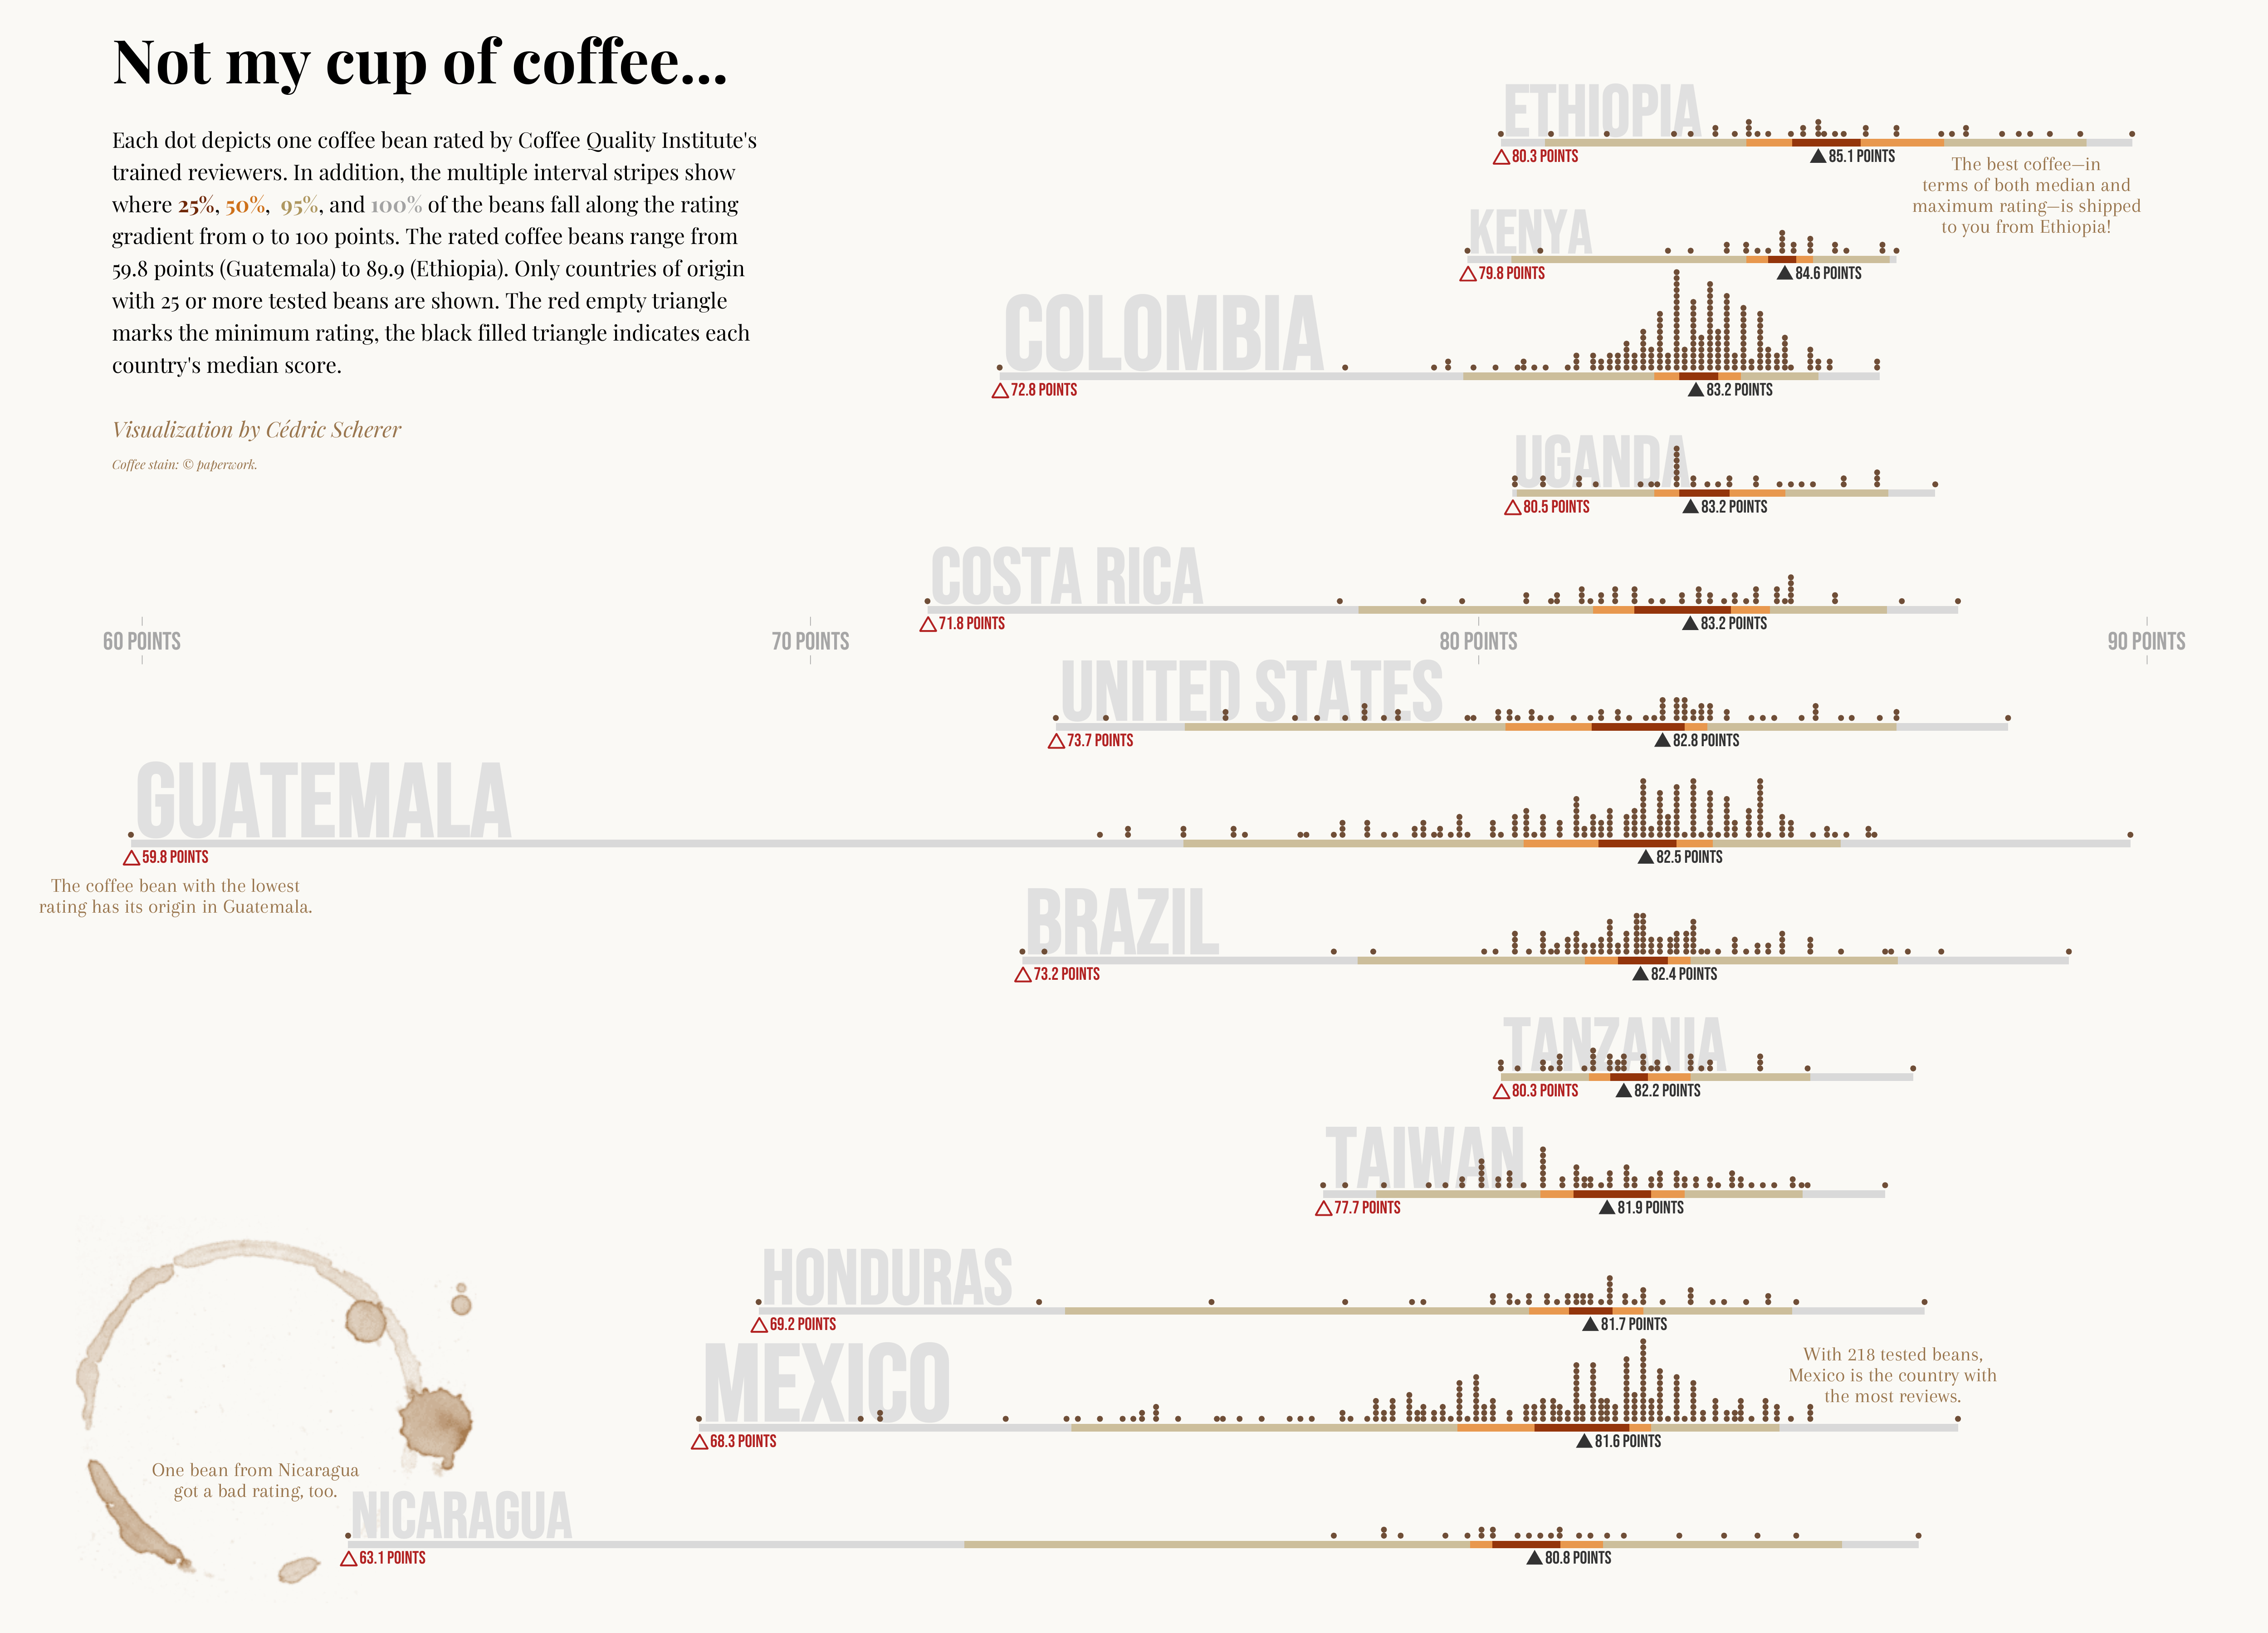
The main visualization shows the countries with 25 or more rated beans; the extended version shows all countries listed. Each dot depicts one coffee bean rating. In addition, the multiple interval stripes show where 25%, 50%,95%, and 100% of the beans fall along the rating gradient from 0 to 100 points.
The rated coffee beans range from 59.8 points (Guatemala) to 89.9 (Ethiopia). Only countries of origin with 25 or more tested beans are shown. The red empty triangle marks the minimum rating, the black filled triangle indicates each country's median score.
As rating data is often very homogeneous, this piece focuses on the beans that have received the worst ratings (red triangles) and thus the title "Not my cup of coffee..." as a reference to the proverb "Not my cup of tea".
The main visualization and the long, alternative version were created as a personal contribution to the #TidyTuesday challenge in July 2020. The visualizations were completely created in R with ggplot2.
The code and images for all versions are publicly available on GitHub.
-
Creditsnone; coffee stamp image by paperwork
-
Award
-
Categories
-
See more


