The Sample Superstore Return Analysis by Maggy Muellner
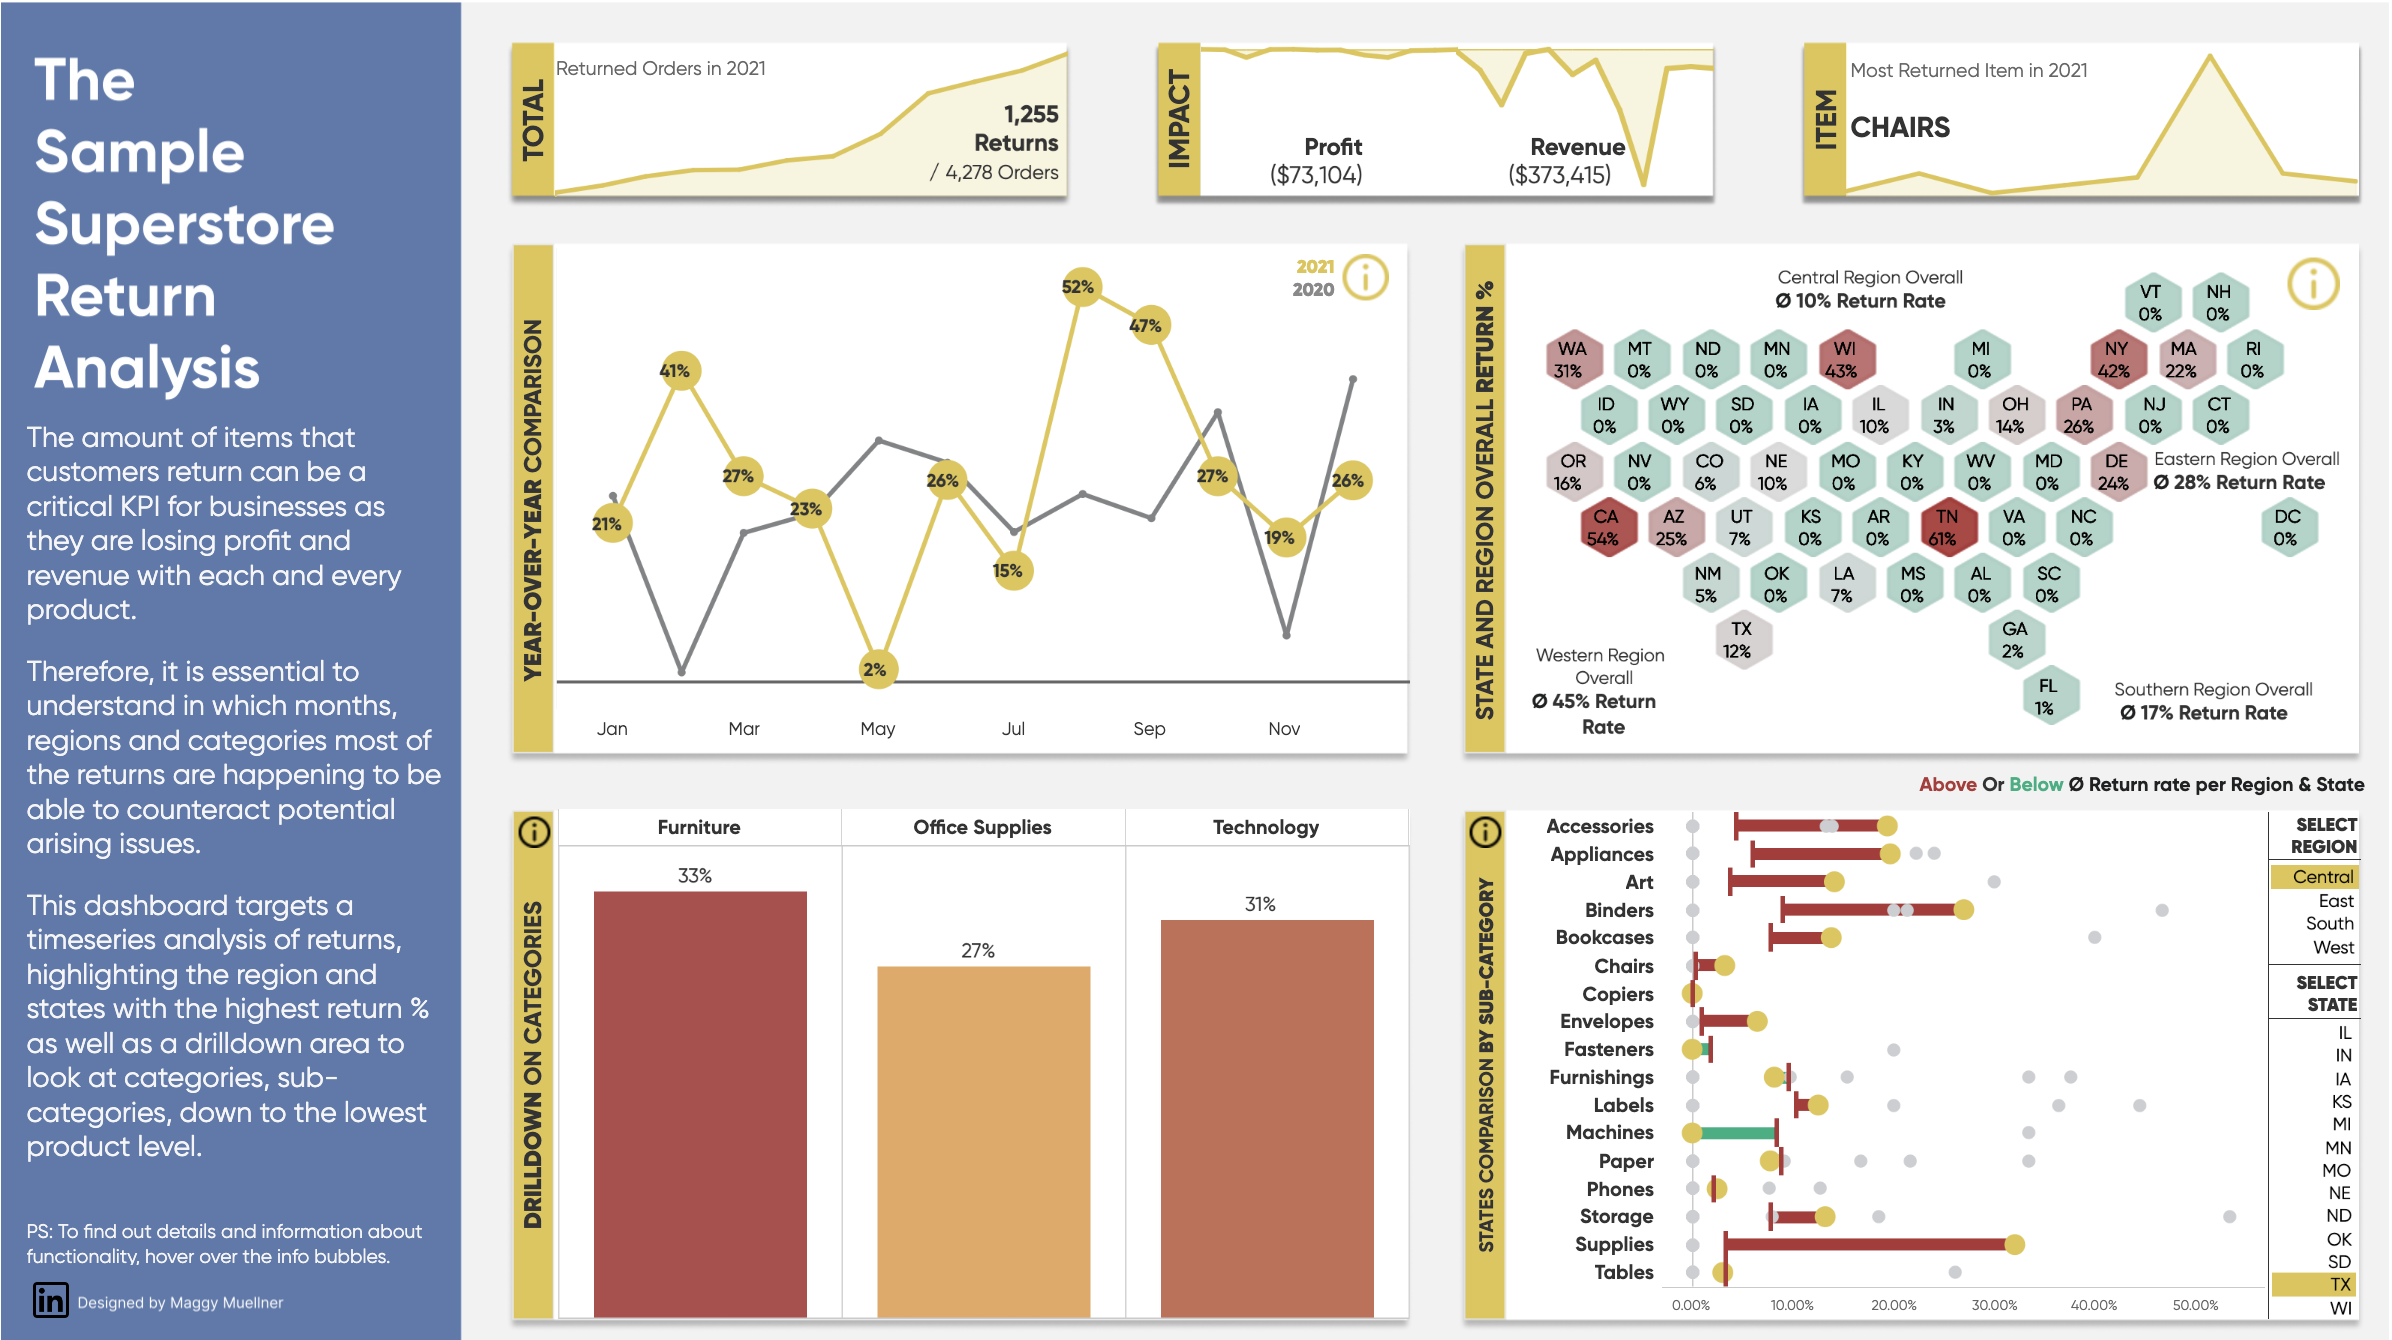
The amount of items that customers return can be a critical KPI for businesses as they are losing profit and revenue with each and every product.
Therefore, it is essential to understand in which months, regions and categories most of the returns are happening to be able to counteract potential arising issues.
This dashboard targets a timeseries analysis of returns, highlighting the region and states with the highest return % as well as a drilldown area to look at categories, sub-categories, down to the lowest product level.
-
Credits
-
Award
-
Categories
-
See more


