35 Years of American Death / Patterns Of Death In The South Still Show The Outlines Of Slavery by FiveThirtyEight
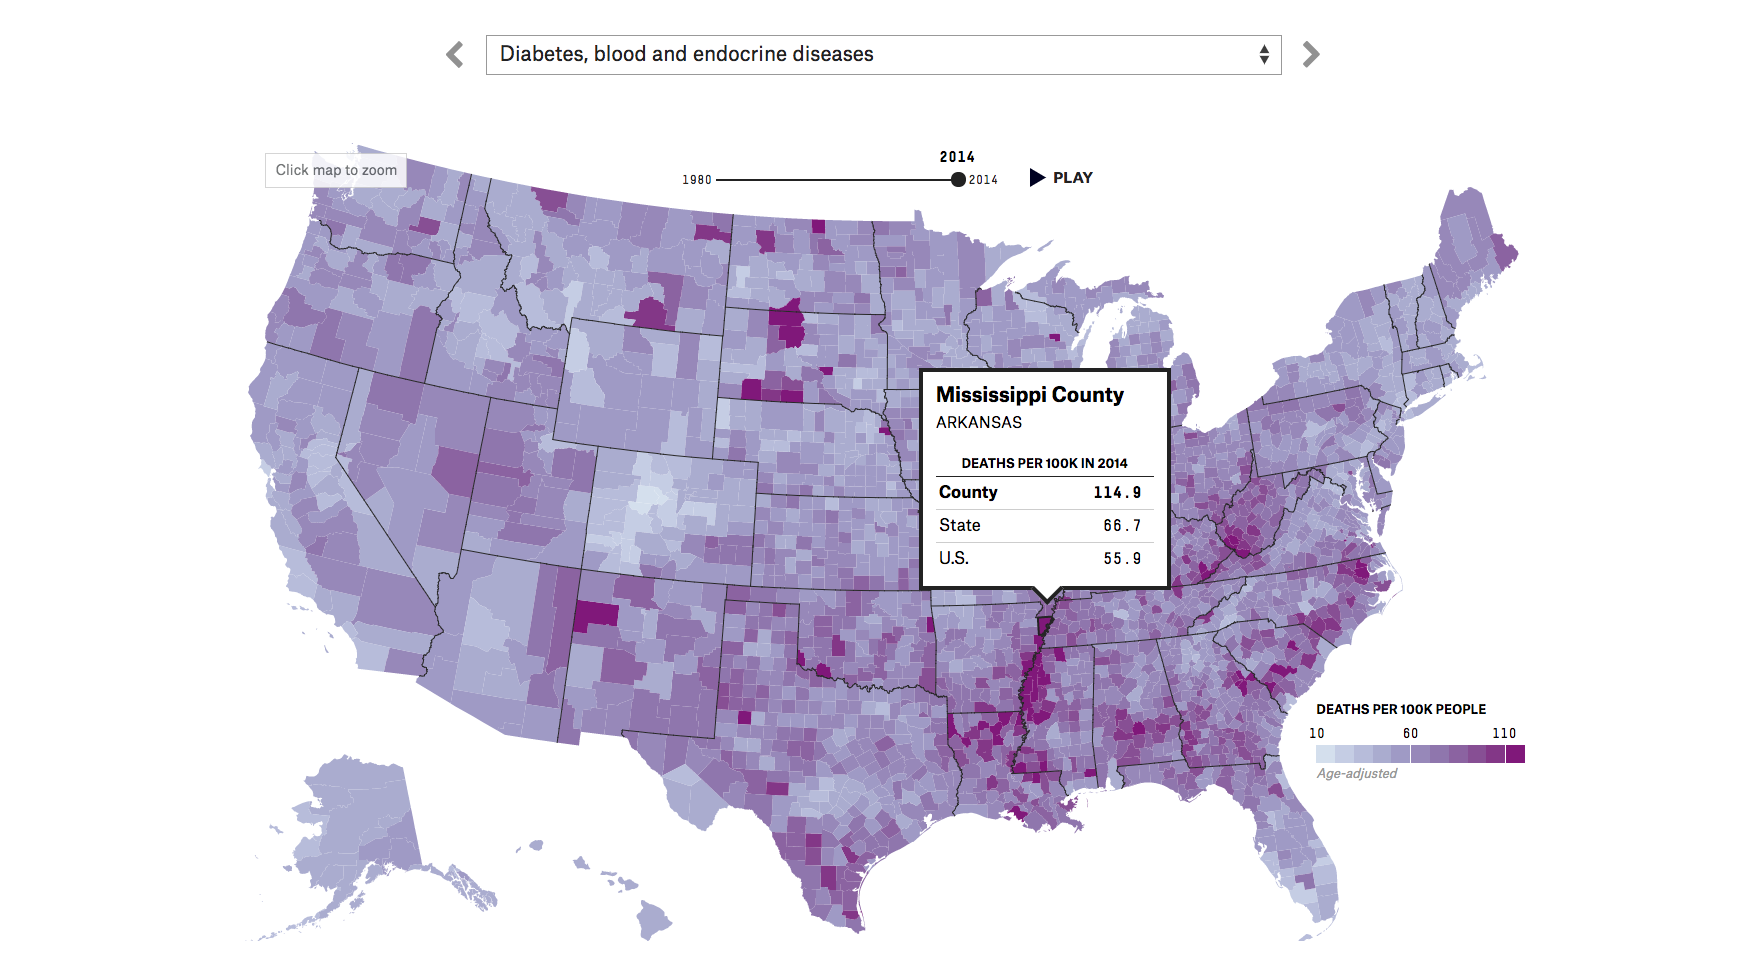
If you look at maps of mortality rates across the country, you might notice a pattern showing up again and again. It's a crescent shape that starts in southeastern Virginia and curves around the Carolinas and Georgia inland of the coast before cutting through Alabama and Mississippi and bleeding into the lower Mississippi Valley. There's an explanation for this shape that stretches back into America's dark past and beyond in geologic time. That crescent was once the coastline of the southeast, and as a result the soil there is extremely fertile and good for growing cotton. The land was used for that purpose, and many slaves were brought there ... today many of the descendants of those slaves still live in those areas, and as rural blacks, face racism, economic deprivation and poor education. Those socioeconomic factors account for the heightened mortality rates visible in the so-called Black Belt.
The story associated with this work explores the realities of the Black Belt today. The interactive is the most comprehensive presentation of mortality rates in the U.S. anywhere. Based on a model developed by the Institute for Health Metrics and Evaluation, the maps include every county, over 60 causes of death, and every year from 1980 to 2014. That's over 2,100 maps.
-
CreditsElla Koeze
-
Award
-
Categories
-
See more


