Email Mobile by Jon Heggestad
I teach digital studies at Davidson College, and for the past several years, I've assigned my students prompts that build off of Stefanie Posavec and Giorgia Lupi's Dear Data project. By following the ideas that these designers put forth in their work, students are tasked with collecting information about their daily habits, experiences, and attitudes. Students then create analog data visualizations, infused with affect, as a means of better understanding their relationship to data as well as to data literacy, more broadly, which we discuss throughout the semester.
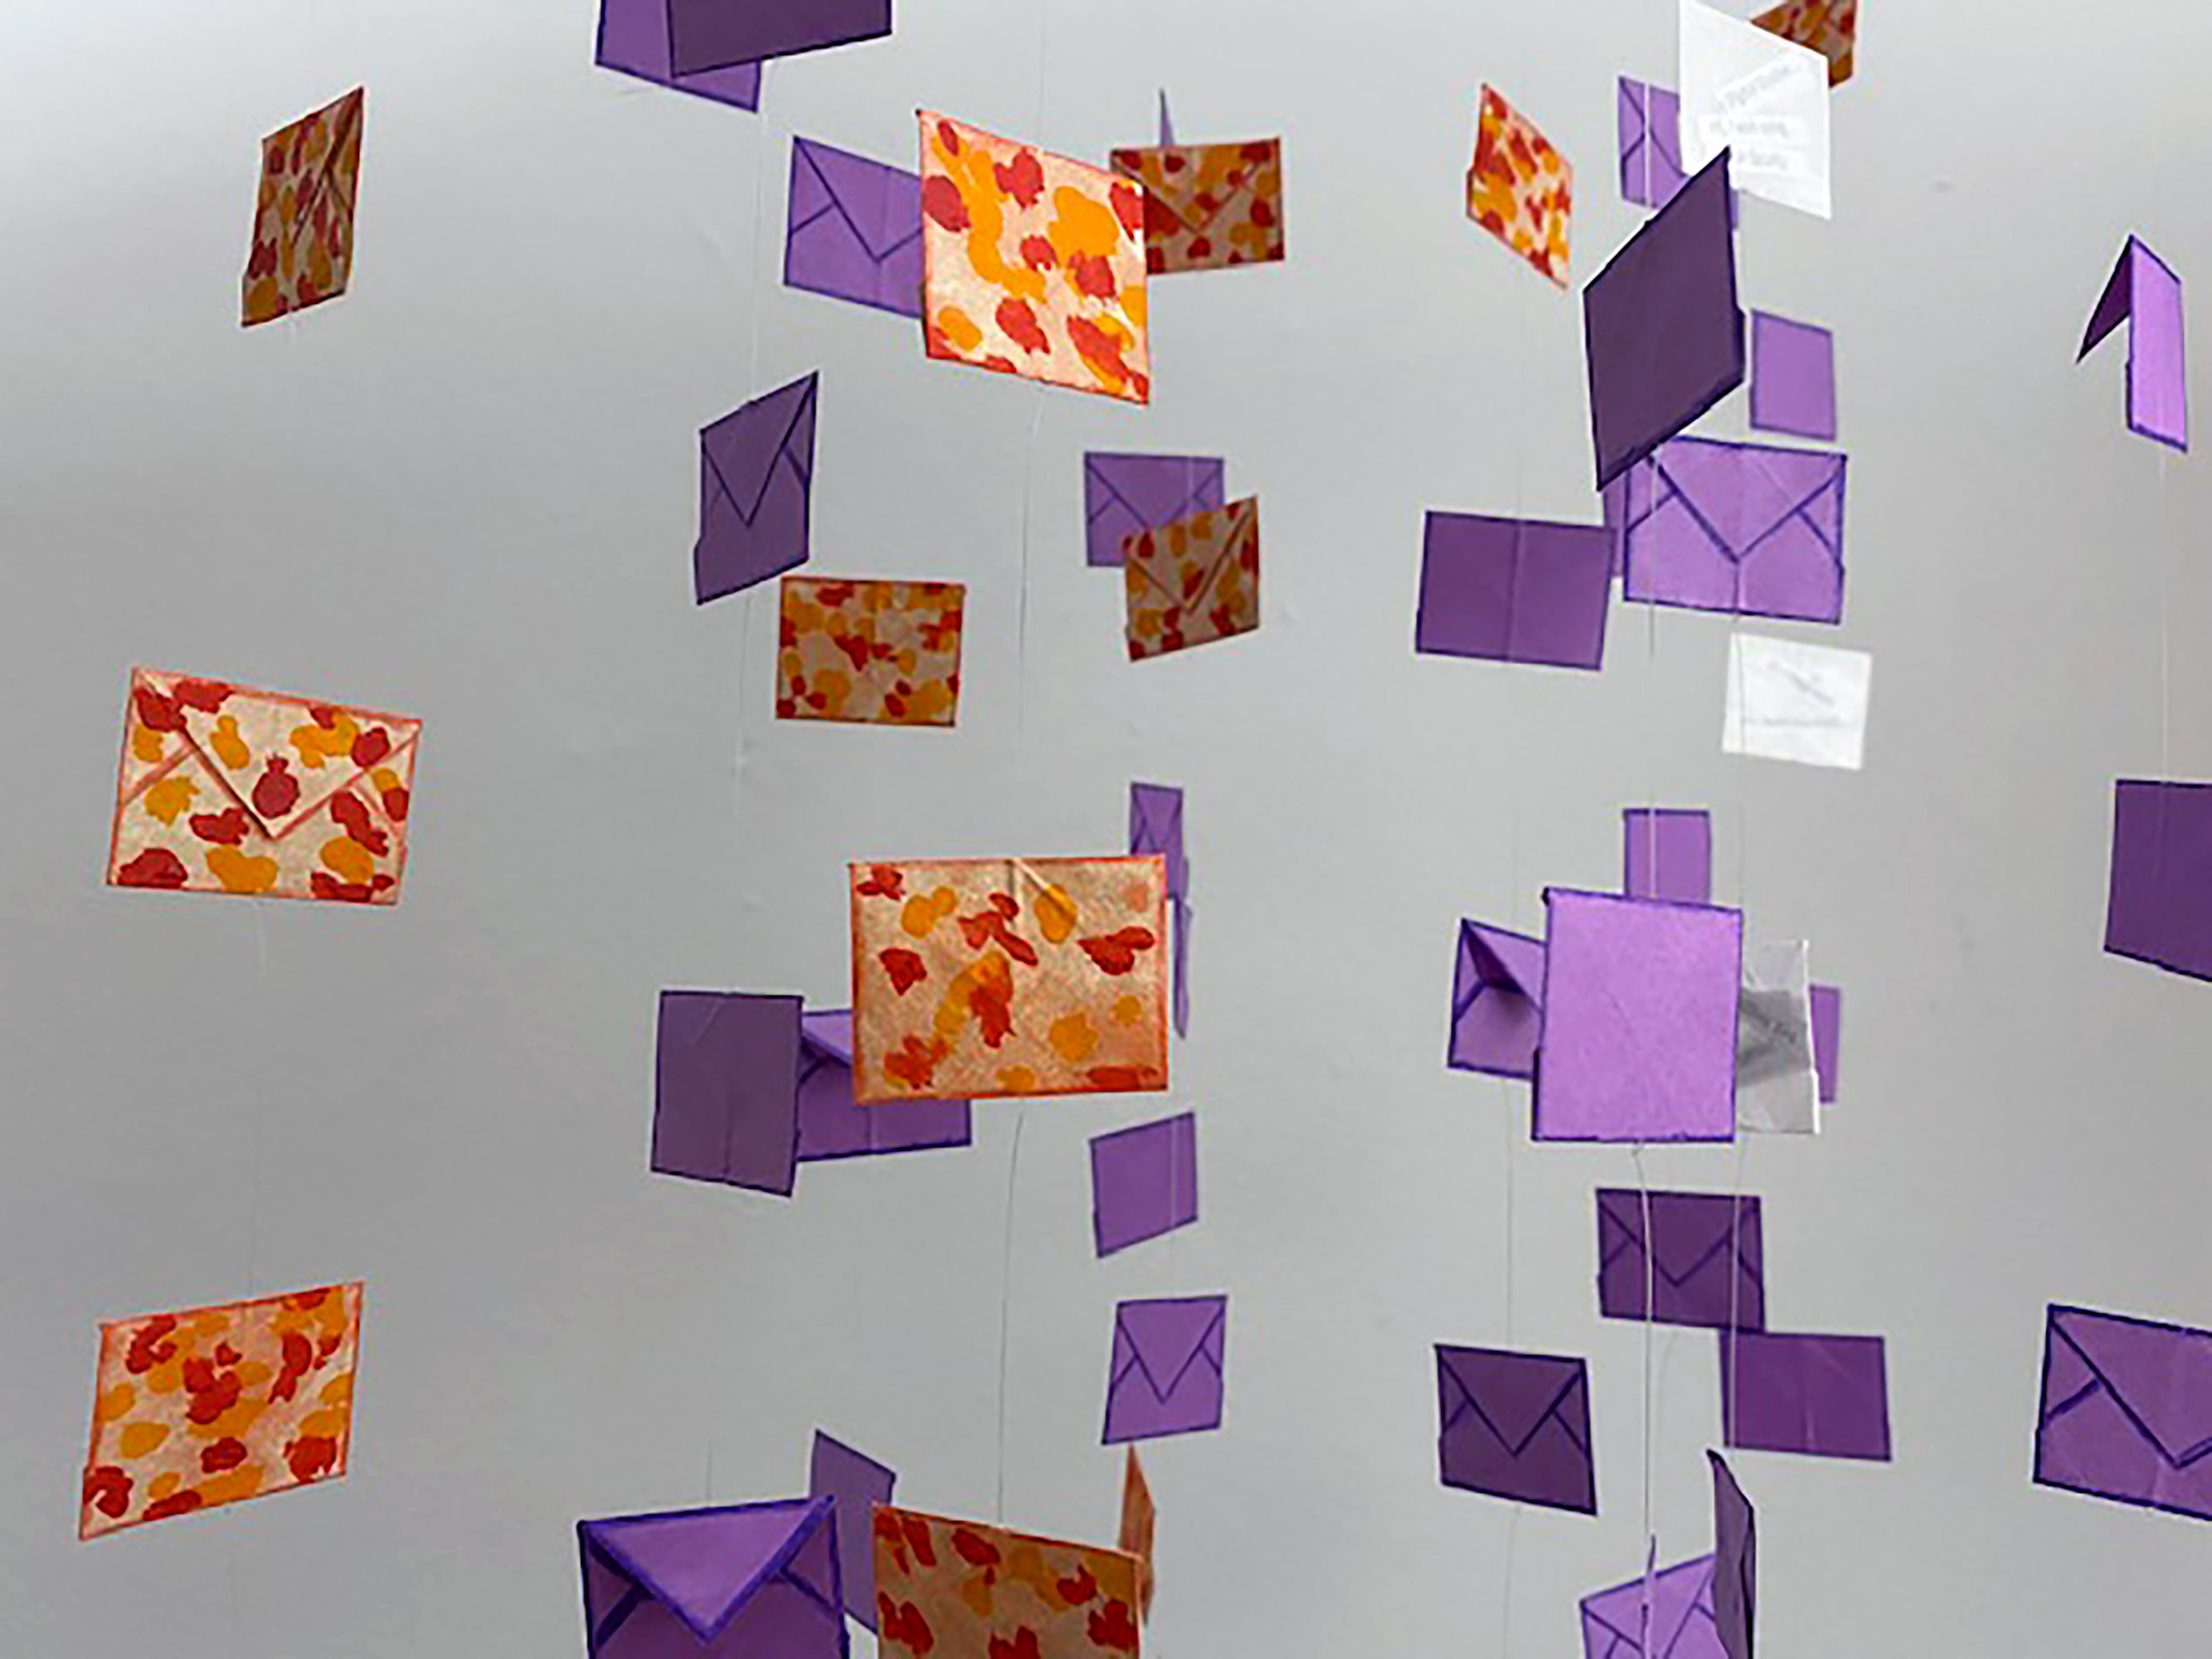
As a rule, I always complete my own prompts alongside my students. For one of my most recent iterations of this project, I decided to record the number of times I checked my email over the course of a week. Around that time, my partner had become frustrated with how frequently I was hitting the refresh button for my inbox, and I was beginning to think he had a point. In collecting my data, I tried to record not only how often I was checking my email, but how often I was doing it out of a sense of anxiety. The orange- and red-speckled envelopes represent these instances (whereas the purple envelopes represent a more neutral occurrence).
Ultimately, I decided to create a third category of email-checking, as I realized that along with my current email, I was also habitually checking an app on my phone that's solely connected to a now-defunct email address. Sure, I could have deleted this app months ago, but the data shows that I chose not to. To represent these instances (haunted by habit), I used a transparent envelope, which allows you to see fragments of writing, a hint at what might be left in my invalid inbox.
Each spoke of the mobile correlates to one day of the week for which I collected my data. Each envelope represents a single time that I checked my email. In total, I checked my inboxes 120 times over the course of this week.
-
Credits
-
Award
-
Categories
-
See more


