Blooming bar charts: The growth of the data visualization industry by Lisa Vissichelli
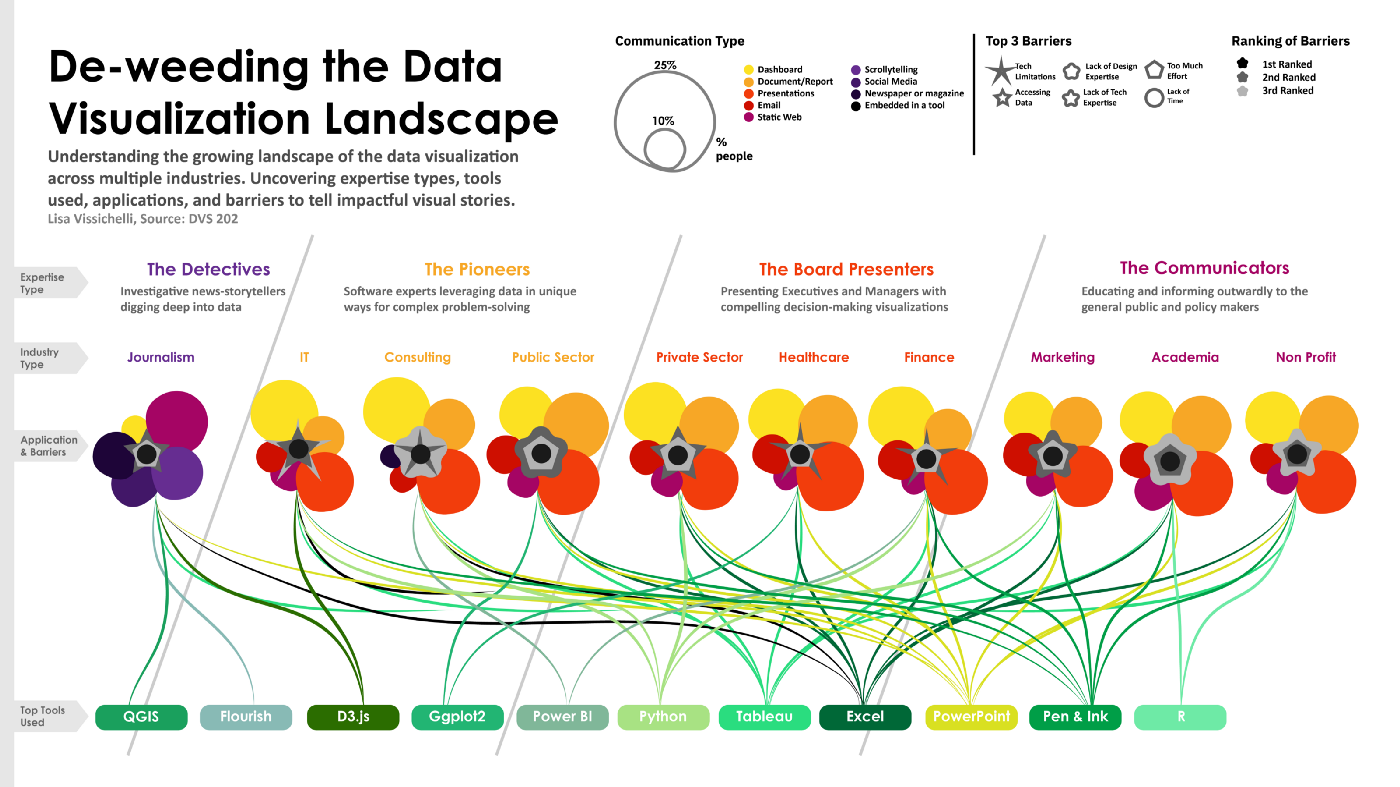
Data visualization has become an integral part of multiple business functions including: financial planning presentations, educational training sessions, board meeting presentations, and marketing outreach.
According to the Data Visualization Society’s 2021 survey, industries ranging from healthcare to marketing are expanding their integration of tools and presentation methods to deliver more custom insights.
Diving into industry specific-trends for 2022, we are seeing an emergence of new tools based on the growth of data visualization applications. In addition, new career opportunities are blooming in design, research, academia, and journalism to deliver these unique areas of expertise.
-
Credits
-
Award
-
Categories
-
See more


