Amsterdam Weather by Leanna McAlpine
We experience it daily but how can weather patterns be interpreted visually? This visual chart is an illustrated retrospective. It highlights the regular rainfall and fluctuating heat over one complete year in Amsterdam in 2019.
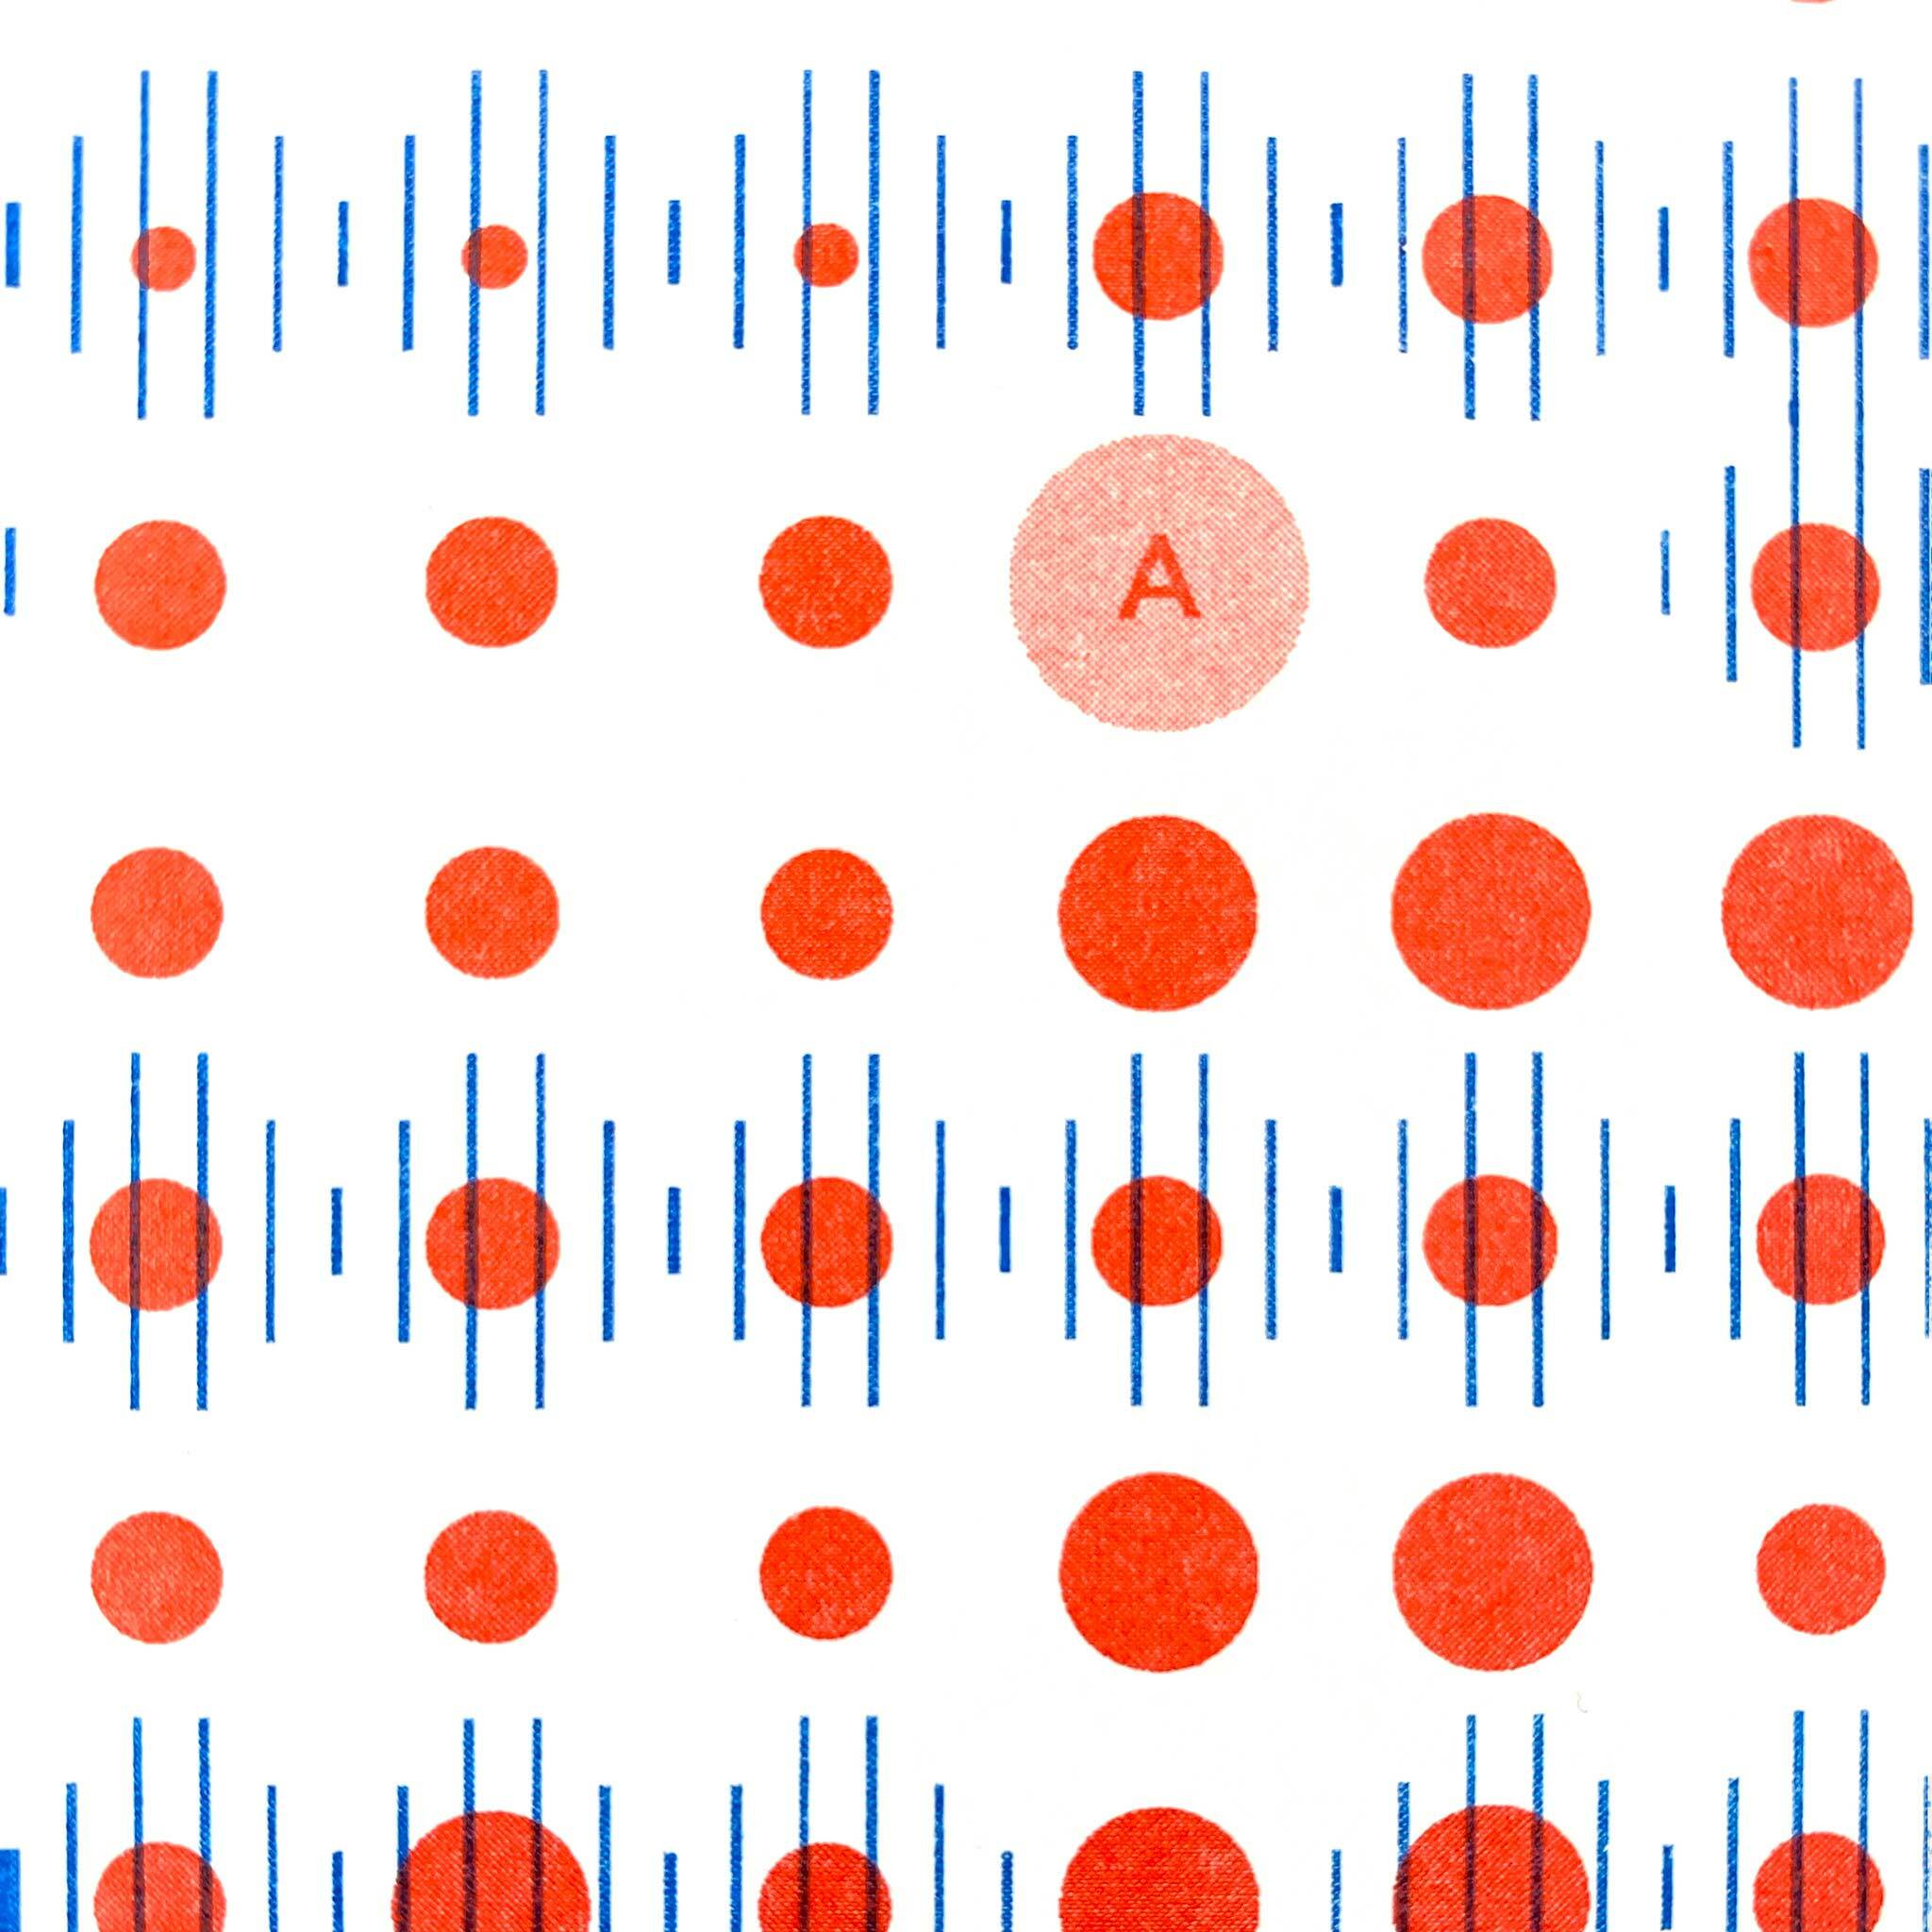
I developed a value system for heat and rainfall to depict this data set in a visually intriguing way. The larger the red dots are the hotter the day, the thicker the blue lines, the heavier the rainfall. This visualisation shows how regular yet light the rainfall is across the year and how concentrated and short the summer days are.
Details:
DIMENSIONS — A3 (297 x 420mm)
DESIGN — Weather pattern in Amsterdam throughout 2019
2 COLOUR PRINT — Red and Blue Risograph Print
PAPER — 170gsm Munken Lynx
PRODUCTION — Printed by hand in Amsterdam
-
Credits
-
Award
-
Categories
-
See more


