Dataplotter - Boom & Bust by Duncan Geere
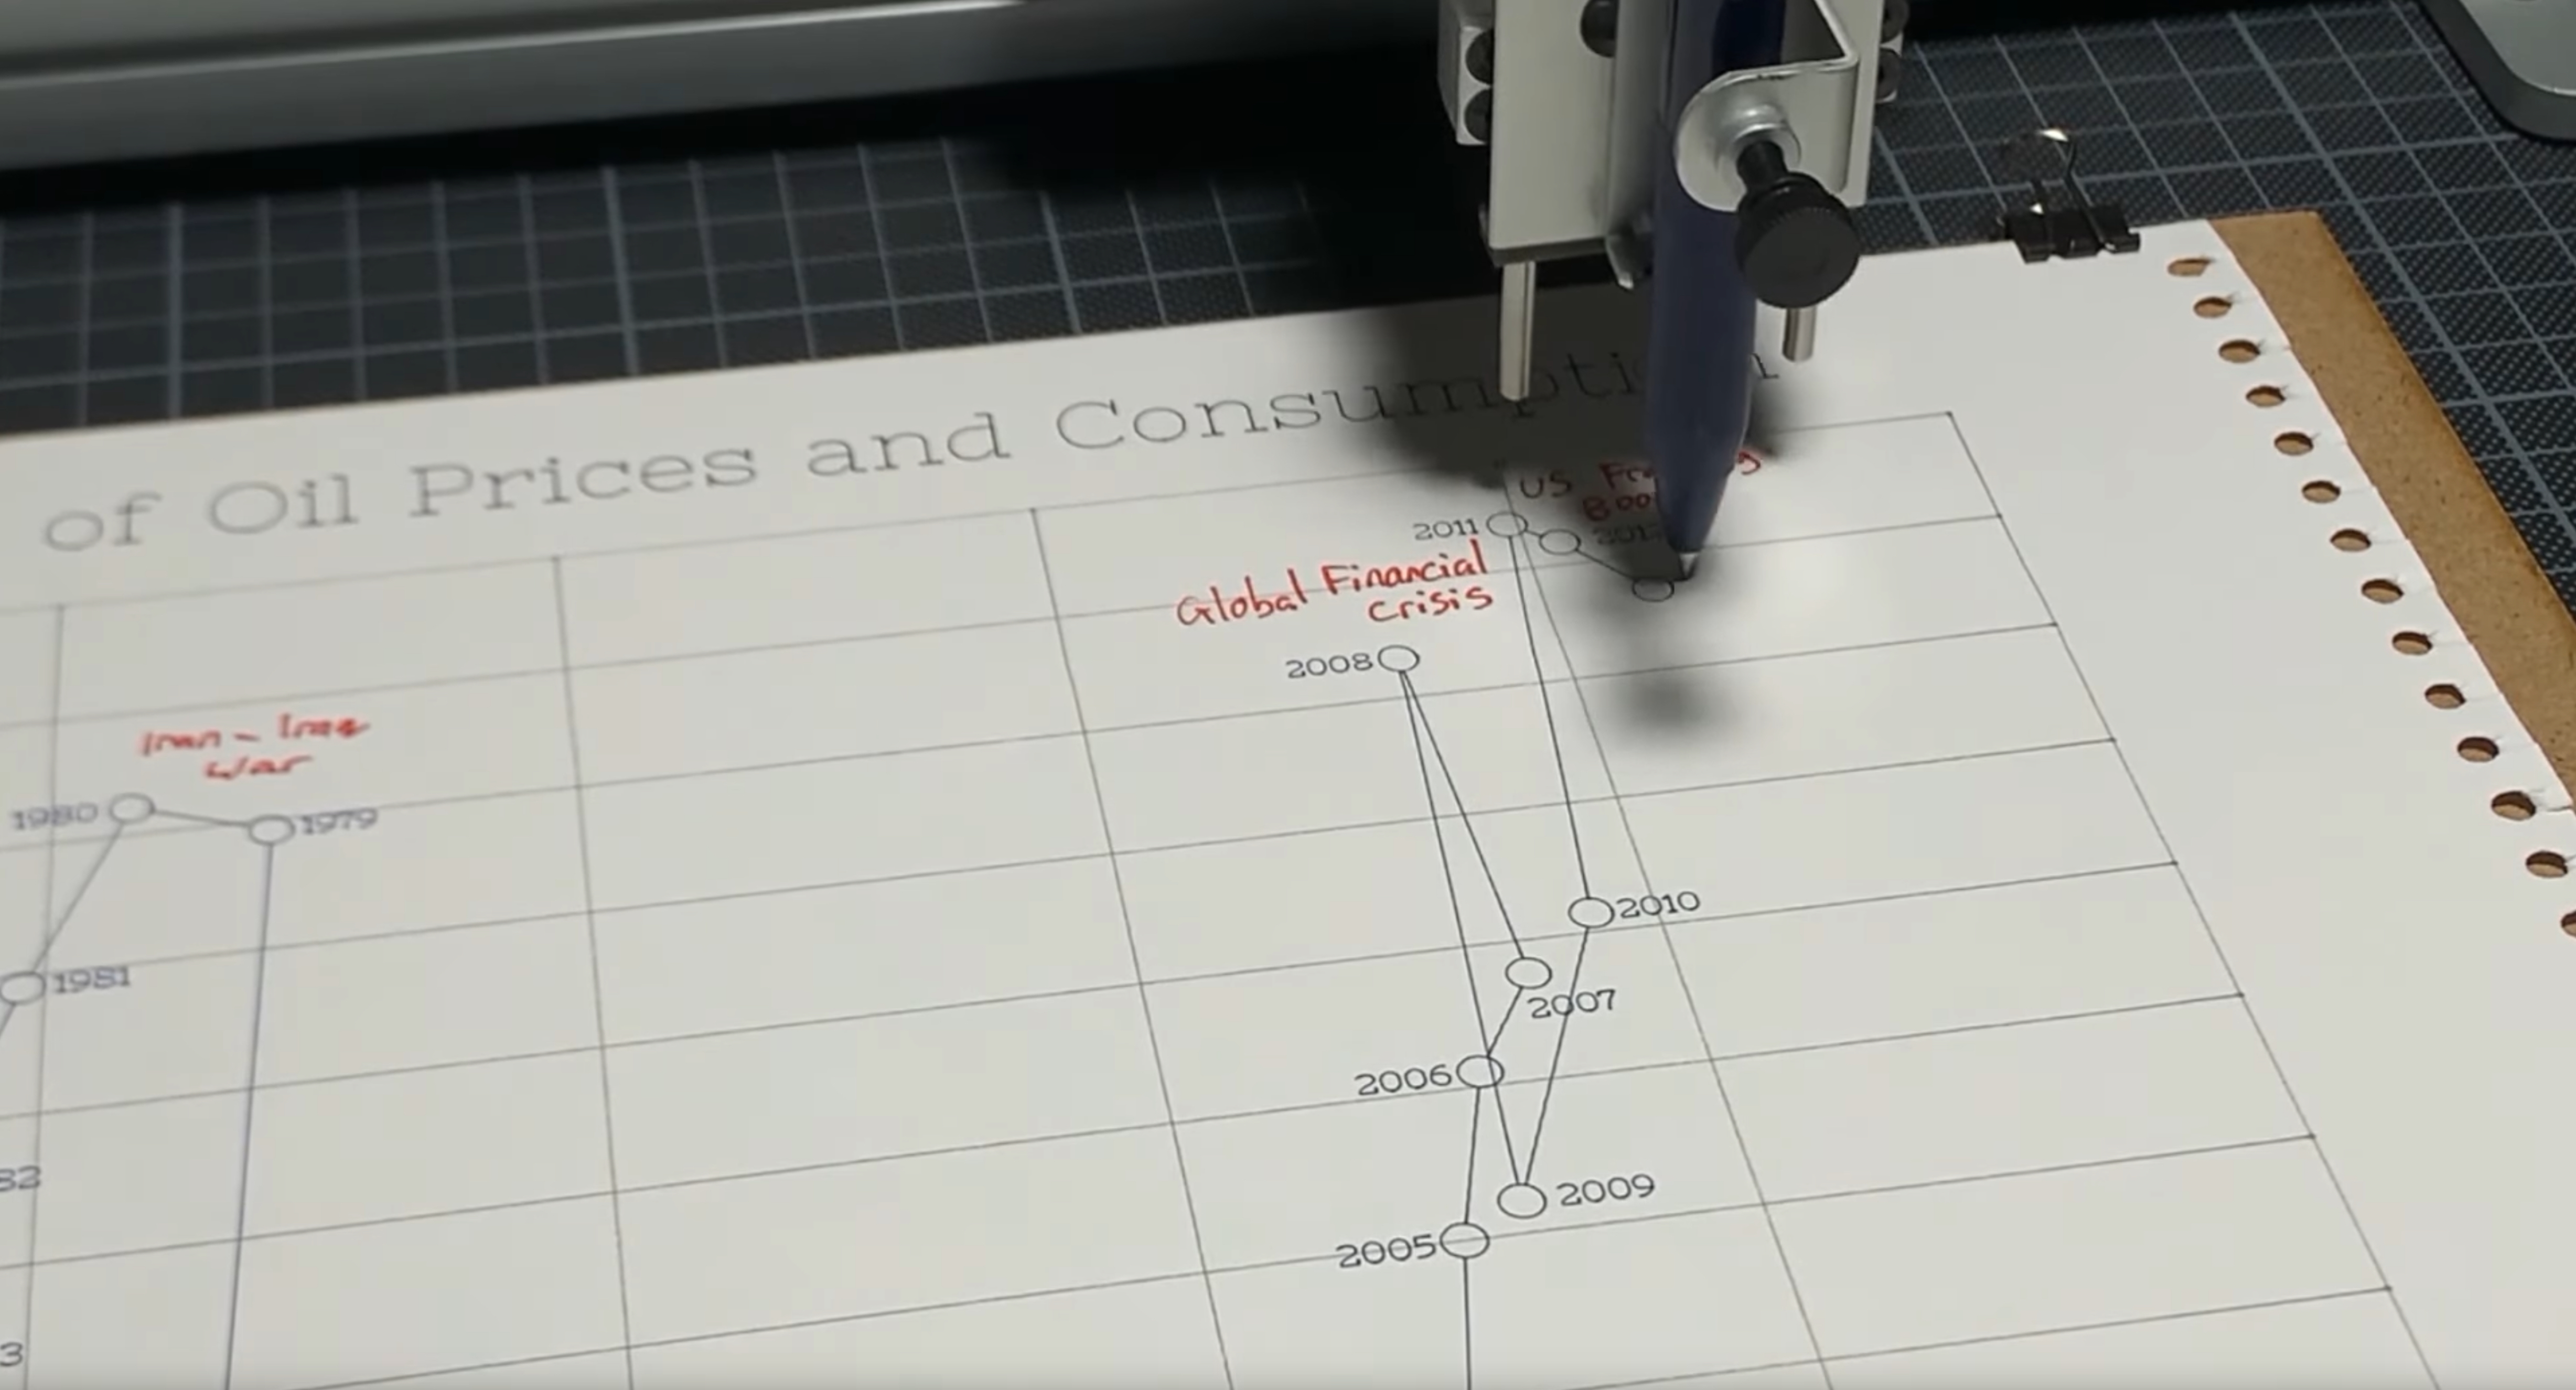
The history of oil prices and consumption, explained. To understand the modern era, you need to understand our weird relationship with oil - from the crises of the 1970s, to the oil glut of the 80s and 90s, to the plunge in prices in recent times. How will it change in the coming years?
Plotted by an Axidraw V3/A3 pen plotter, on 170ggm A3 paper, with a 0.2mm black Derwent Graphik line marker, a 0.5 grey Derwent Graphik line marker, a blue Zebra Sarasa Clip gel pen, and red and green ultrafine-tipped Sharpie markers.
-
Credits
-
Award
-
Categories
-
See more


