Satellite Charts by Cinzia Bongino
“Satellites Charts” examines current and past artificial satellites orbiting around Earth, pointing out how our terrestrial life became so dependent on what we sent out in space. With topics ranging from space exploration to space pollution, communication, and warfare, the large Beeswarm chart functions as an index to unlock related stories.
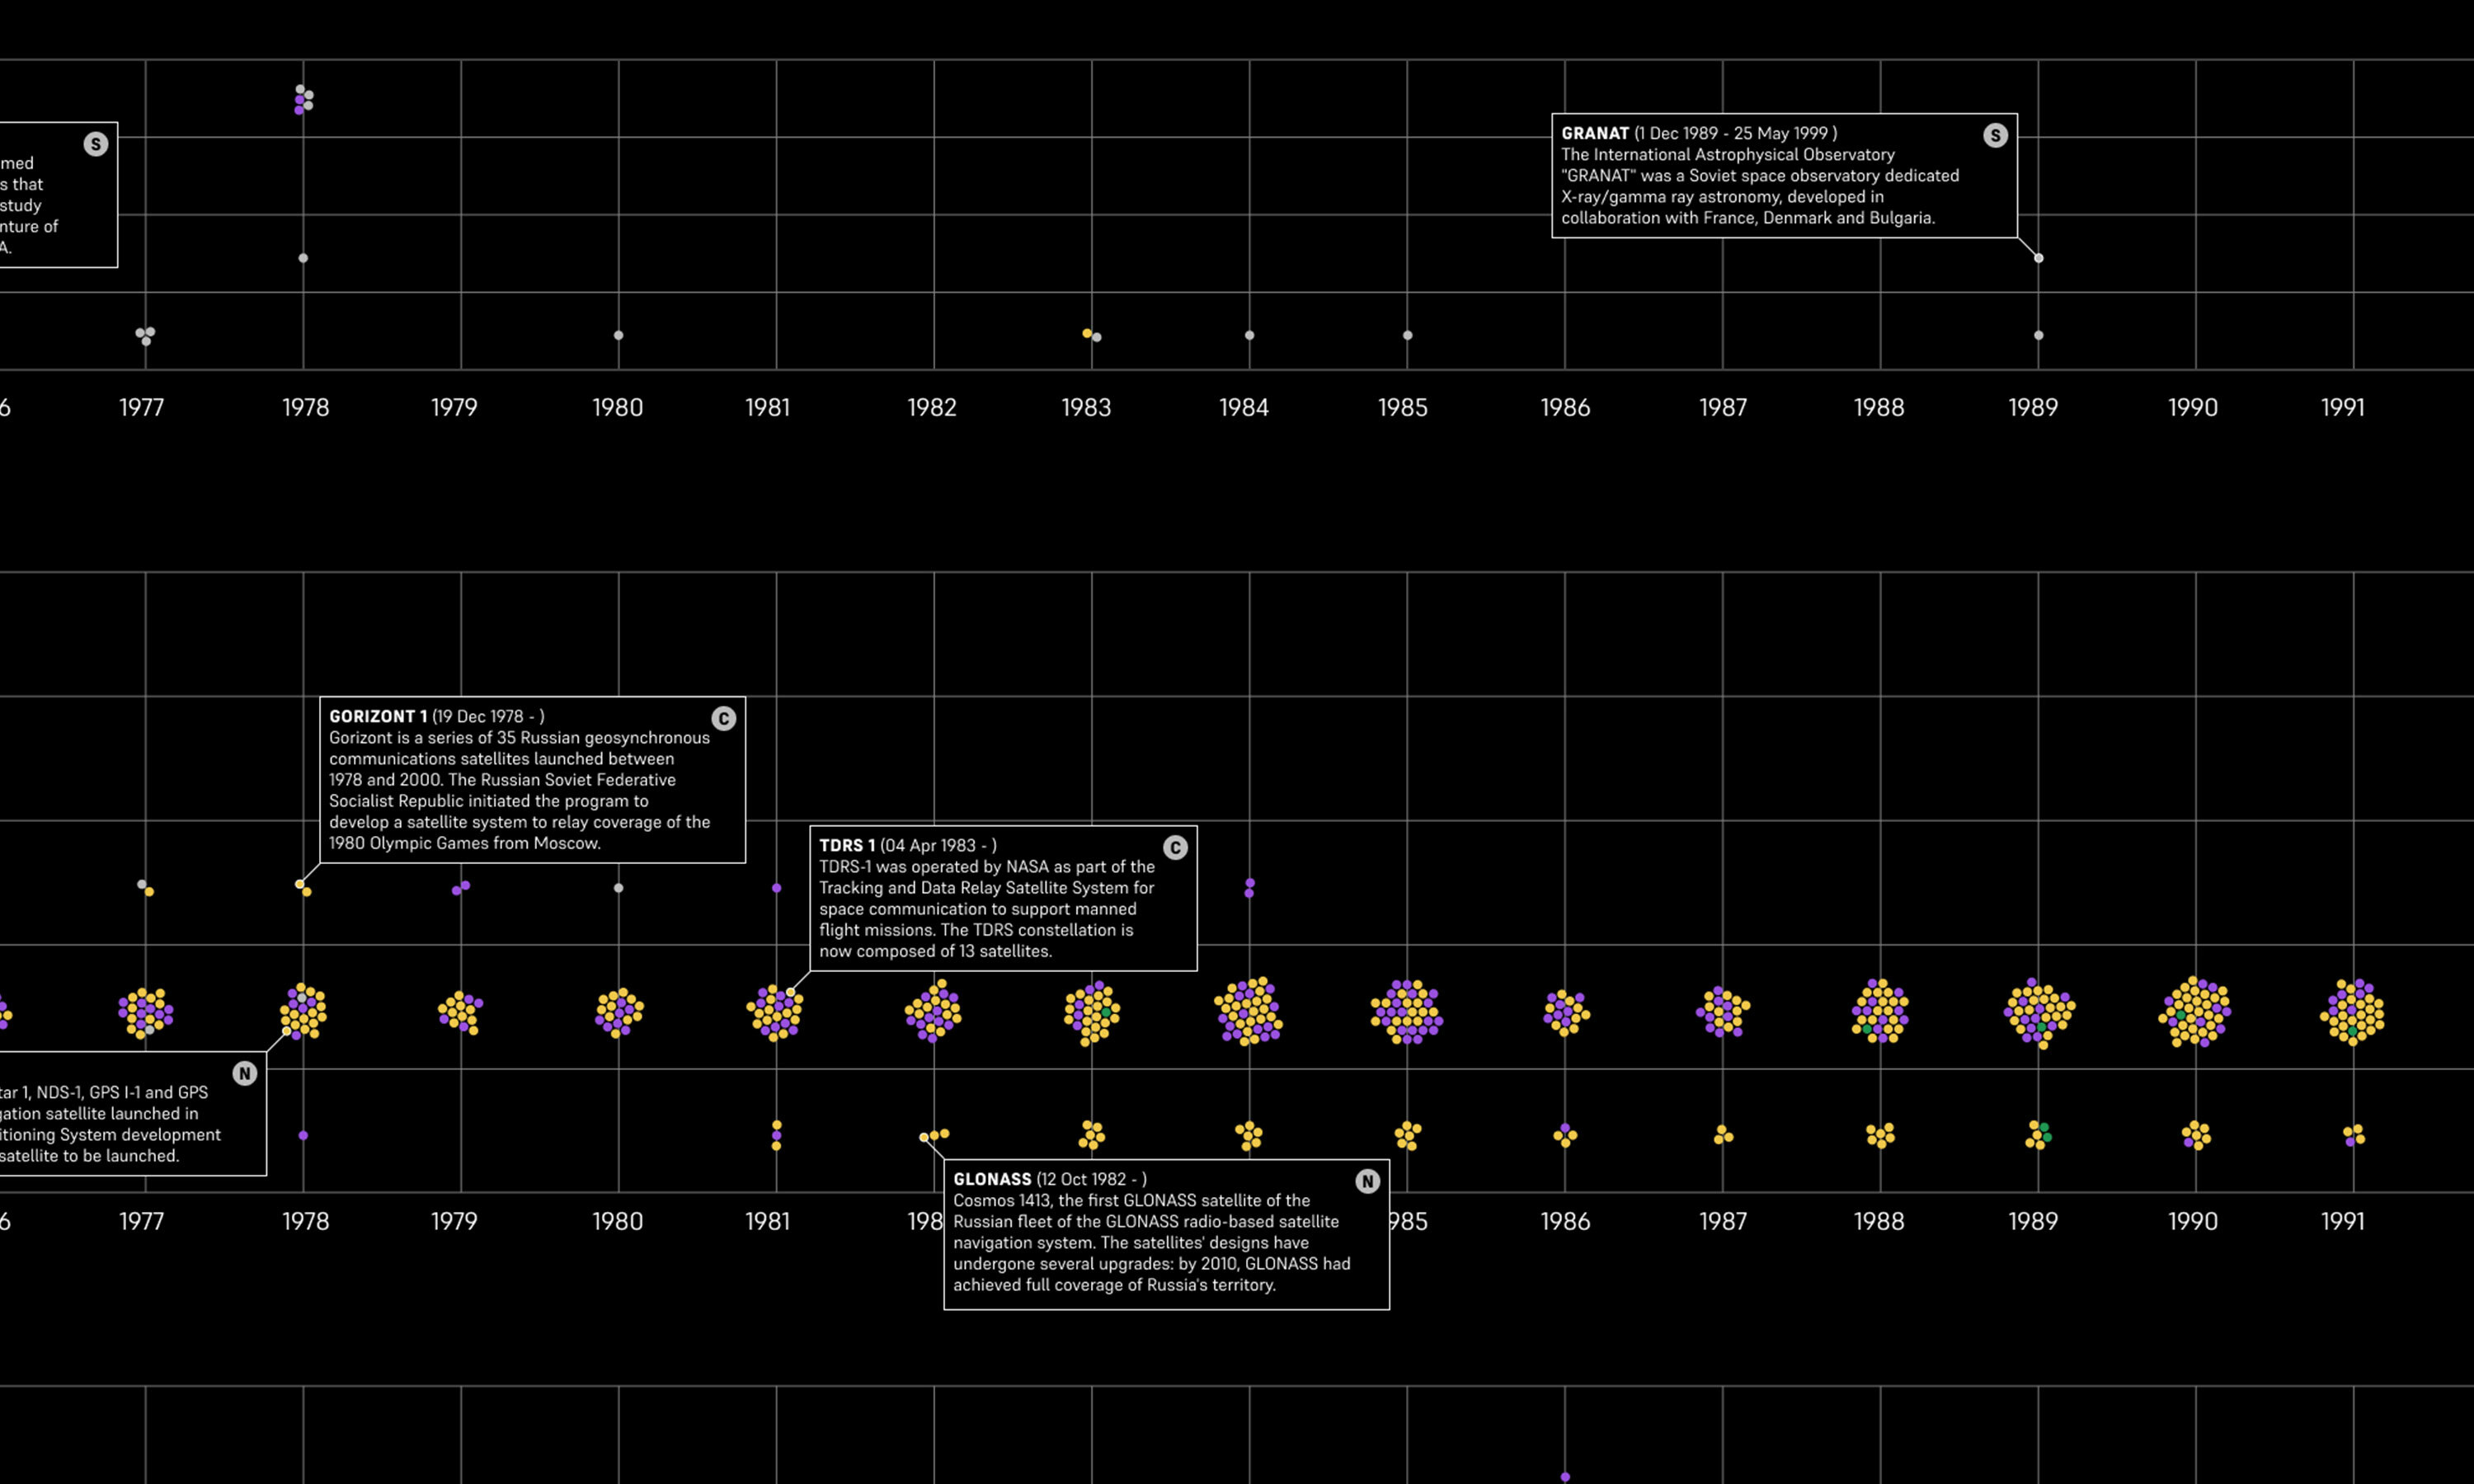
More than eight thousand satellites are plotted on the graph: the data show how many satellites are still operational or decayed, who launched them, and in which years. Displaying such information on a flat design allow the viewers to zoom in and out in time. In 65 years of space history, we slowly built an extension of Earth's infrastructure above our head, an extra level of data collection and exchange. Satellites are essential technologies that must be constantly safeguarded, especially from human threats: jobs, services, social gatherings, transport, and communications are strictly dependent on the network of artificial bodies monitoring the planet. It is impossible to imagine our current living standards and global connections without the data transmission between satellites and Earth stations. This is what keeps the world spinning.
“Satellites Charts” has been realised for the Randr Satellite Project, a digital exhibition focusing on projects dealing with political design. The website was further developed with two updates: an interactive map showcasing where satellites and spacecraft are launched to space, and a group of static charts on space debris.
-
CreditsThis is a personal project. I took care of everything, from research to data analysis and visualization, to the web development.
-
Award
-
Categories
-
See more


