A Network Map of The Witcher by Milan Janosov
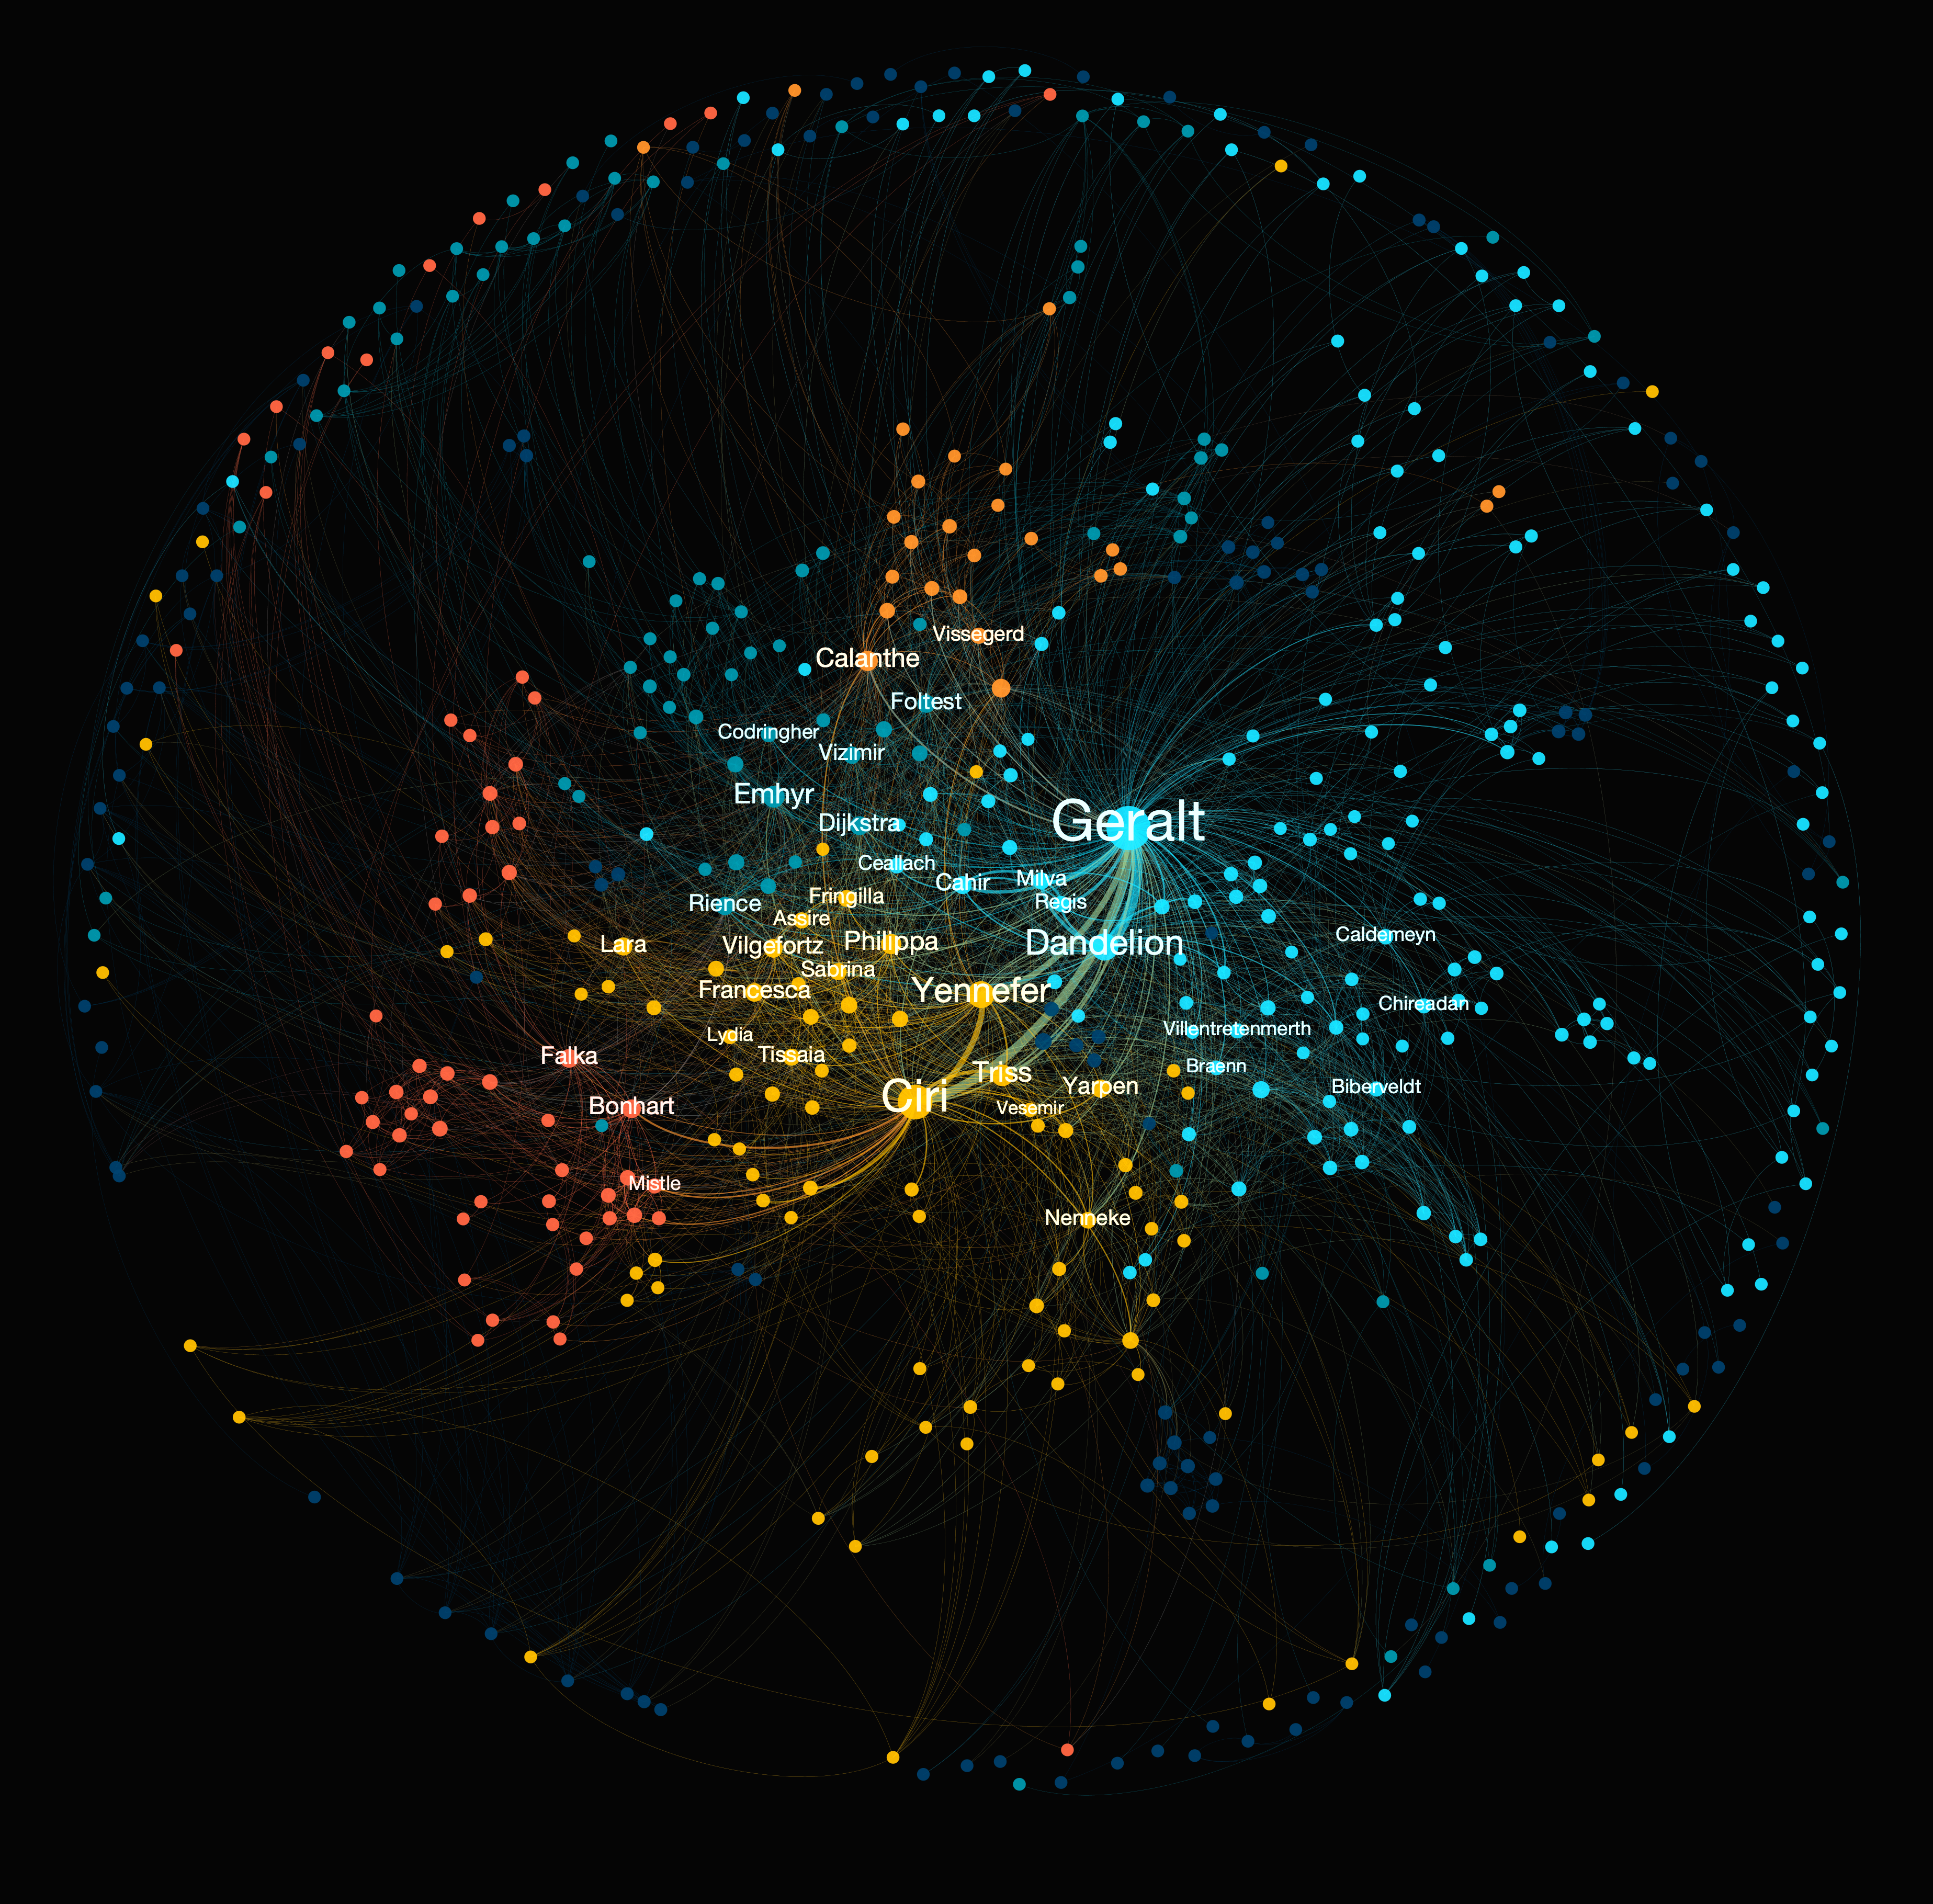
The Witcher, a fantasy novel series by Andrzej Sapkowski, has inspired multiple computer games and was even launched on Netflix in 2019, with the latest season airing in December 2021. Fictional storylines such as The Witcher, can be well summarized and simplified by network science, extracting the backbone of a complex series of events. In other words, network mapping and data science can transform thousands of pages into one simple, visual, social map. This exemplary visualization highlights the power of network science in text-analysis by uncovering hidden patterns, such as influencers, hubs, cliques, storylines, and plot twists via the interplay of hundreds of people and their countless encounters in an objective, quantitative way.
The visualization is a result of several data processing and analytics scripts turning the book series as a stream of textual data into a graph object by self-written Python scripts, that resulted in the visualized graph object. This object was later visualized by Gephi using force layout, while I designed the color scheme in Adobe Colors and gave a final touch to the labeling in Photoshop.
-
Credits
-
Award
-
Categories
-
See more


