Real-time Real Estate SOLD VOLUME by Metro MLS
About us:
We are the transaction/data service system used by most real estate agents in the state of Wisconsin, information on activity throughout our service is crucial to the livelihoods of many (agents, consumers, industries, etc…).
I’m always scouting for new areas to deliver value based on the data we consume and create. Which lead me down the path of creating the visualization submitted.
The project:
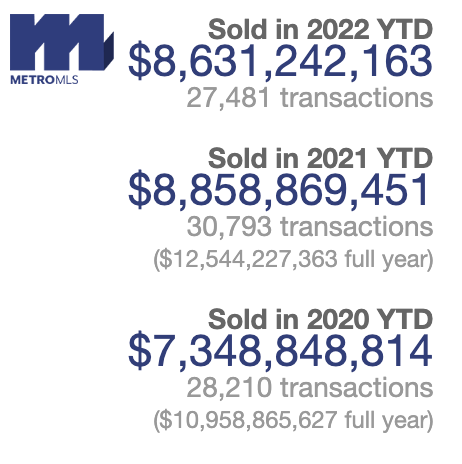
Our project is titled “The Sold Volume Widget”.
This widget displays the total sold volume ($) of all real estate listed in our service (state of Wisconsin). The sold volume is calculated in a year-to-date (YTD) format over a three (3) year span. This means the widget displays YTD volume in a three (3) year span, based on the exact date you are viewing.
As added bonus, data in the widget is in real-time (as it happens in our service).
A great visualization is valuable but it needs visibility to enhance its value. We decided to have this automatically generated and placed in the footer of each EMAIL as well as provide it as a widget subscribers can use on their website to instantly add value to their digital presence.
The sold volume widget is LIVE and has been well-received by subscribers, consumers, colleagues, etc… While it may not be described as “beautiful” - looks can be deceiving. Thought was given to its “stock market ticker” style visual.
I believe, data visualization is really about delivering complexity at a high absorption rate. Sure, we can use line graphs in the sold volume widget but that still requires time for the viewer to understand what the data is saying.
In an email, you are limited to a “glance view”. Data visualization has to be quick and to the point.
Displaying the data in “monetary values” really hits at the core for most. Even children understand the concept of money and what a higher or lower number represents.
The sold volume widget is a visualization of data that is easily consumed. It reinforces the value of our service and informs the viewer of an important metric - where the real estate market is going - all in a quick glance.
It also brings added value to a non-favorite in EMAIL.
The sold volume widget can be viewed in the submittal and on the following URL - http://widgets.metromls.com/salesCounter/
Thanks for reading! -Chris
-
Credits
-
Award
-
Categories
-
See more


