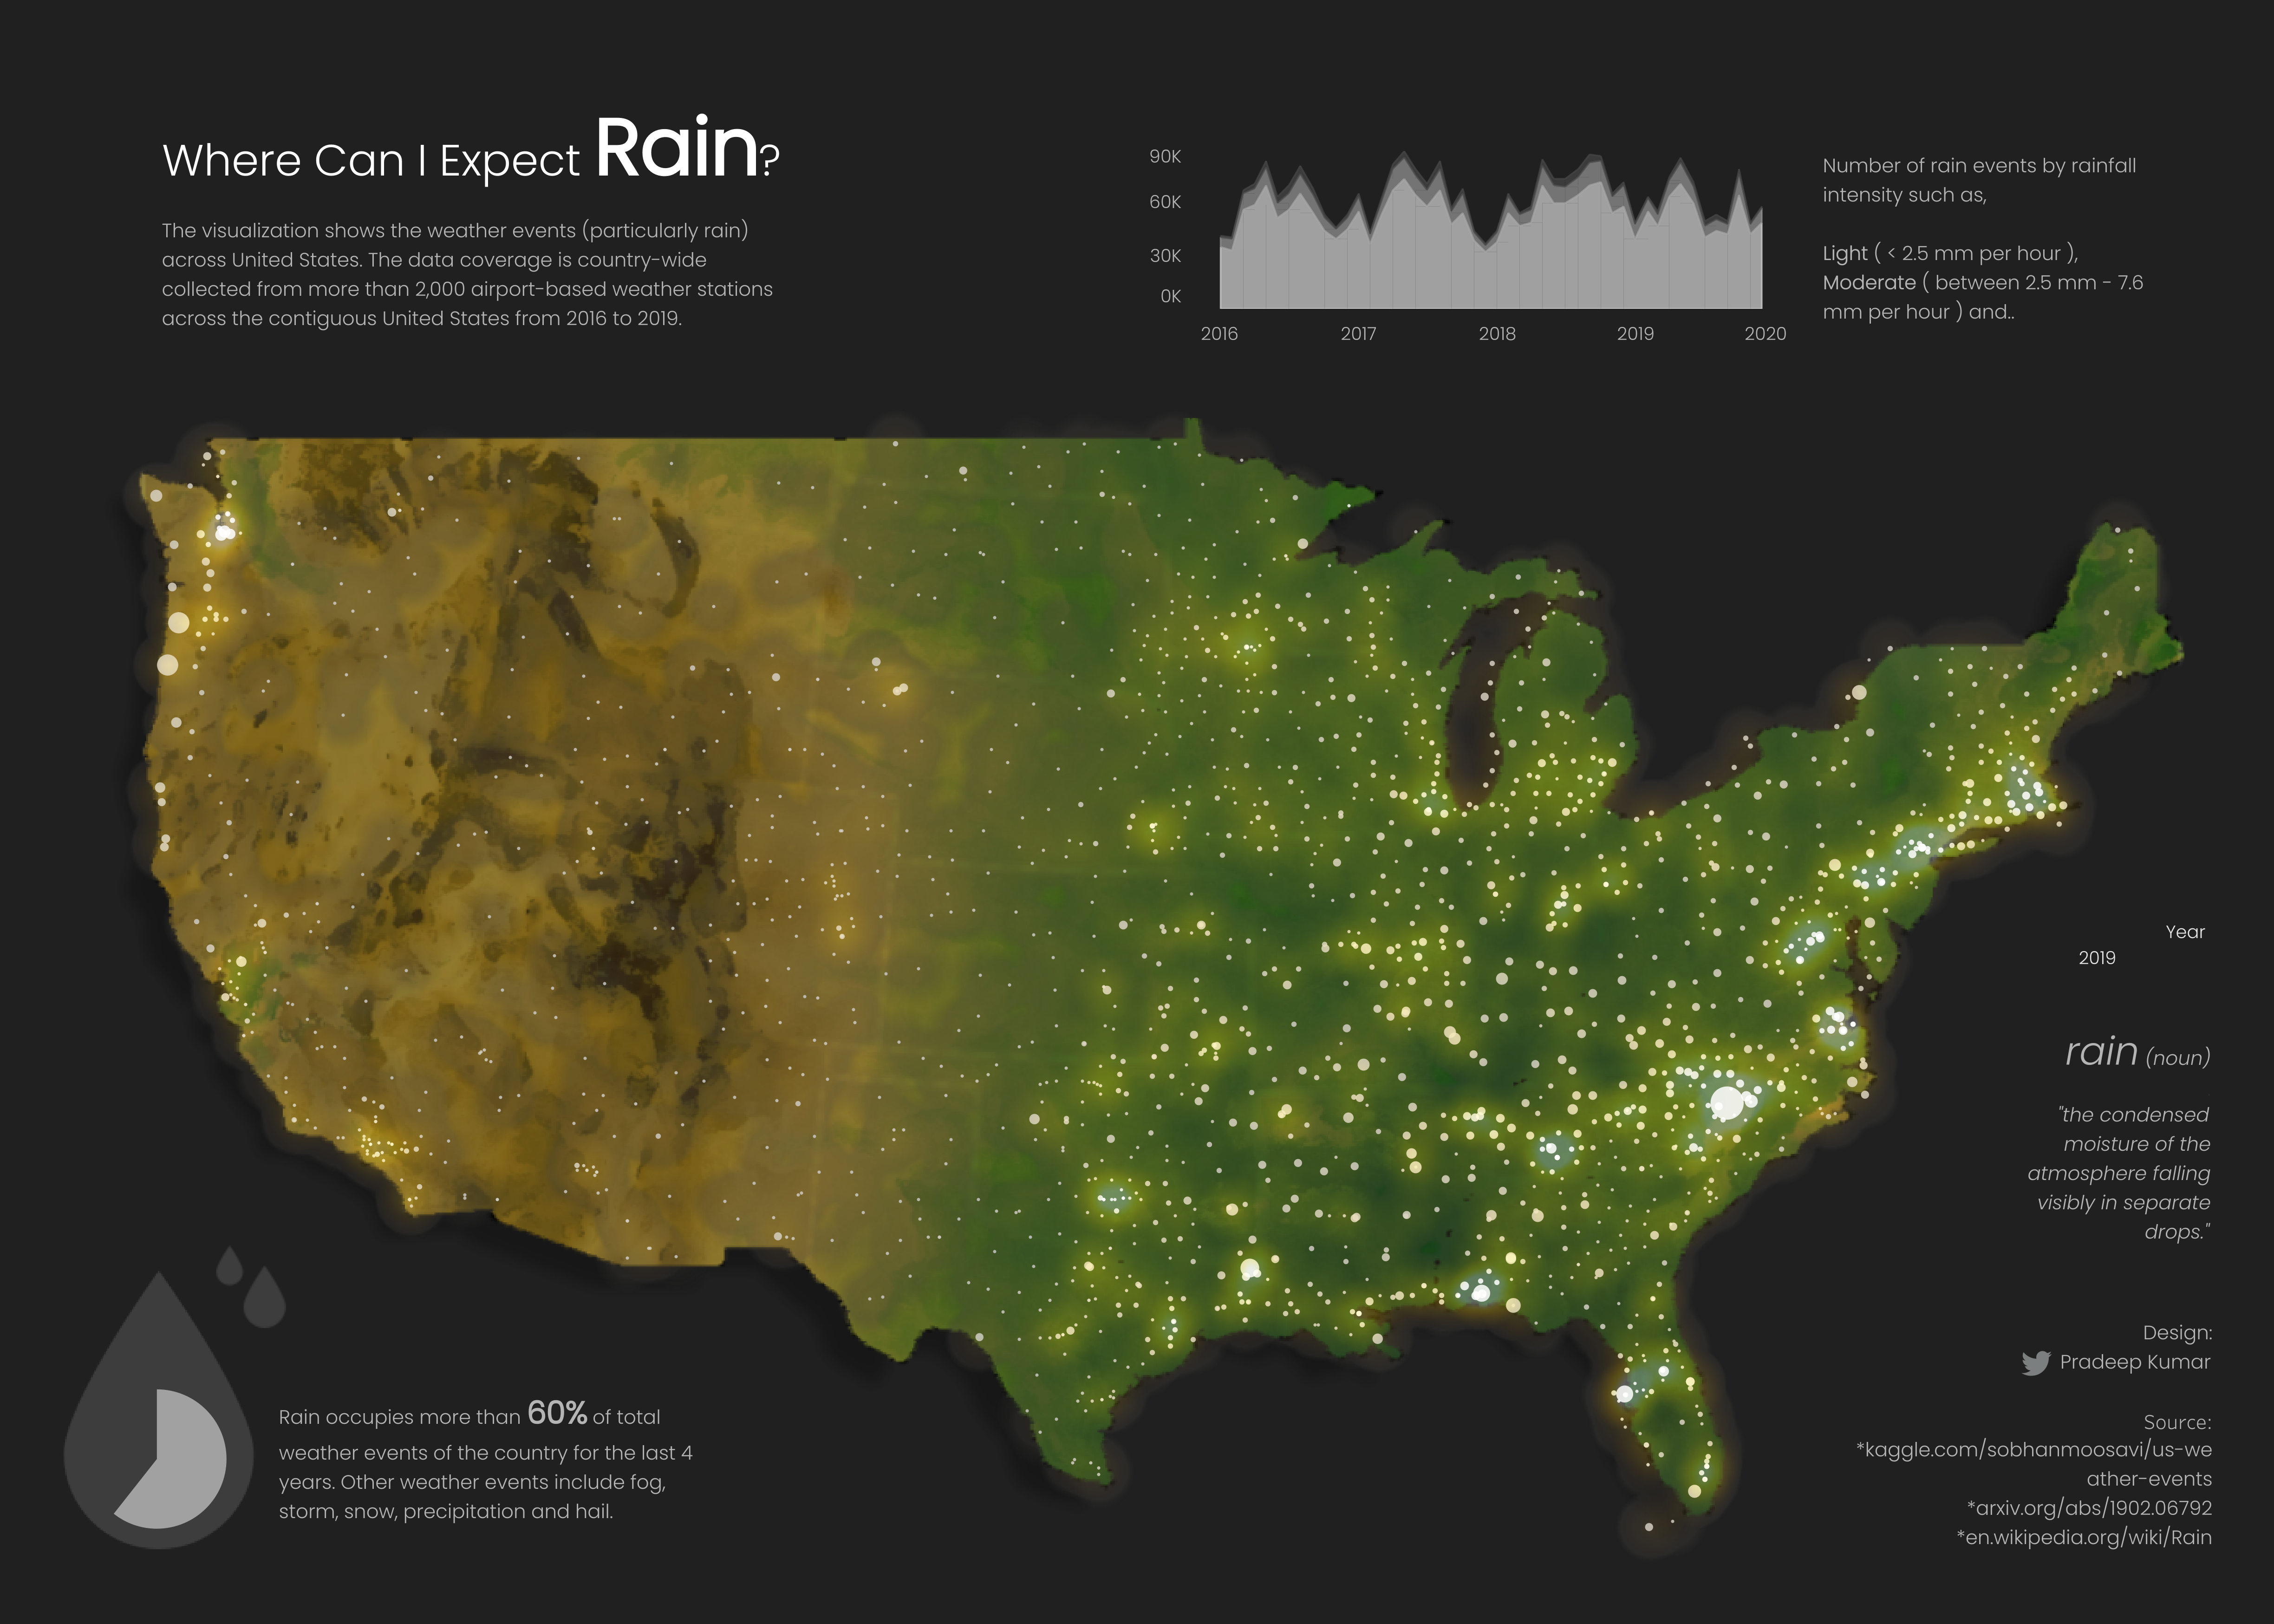
Where Can I Expect Rain? by Pradeep Kumar G
The visualization is created using Tableau software, and some design elements are created with MS PowerPoint. The viz shows the rain weather events across the United States. The data coverage is country-wide collected from more than 2,000 airport-based weather stations across the contiguous United States from 2016 to 2019. The circles on the map are created with a combination of bubble and heatmap which represent the number of rain events at different weather stations.
-
Credits
-
Award
-
Categories
-
See more


