Ride Against The Flow by Scott Spencer
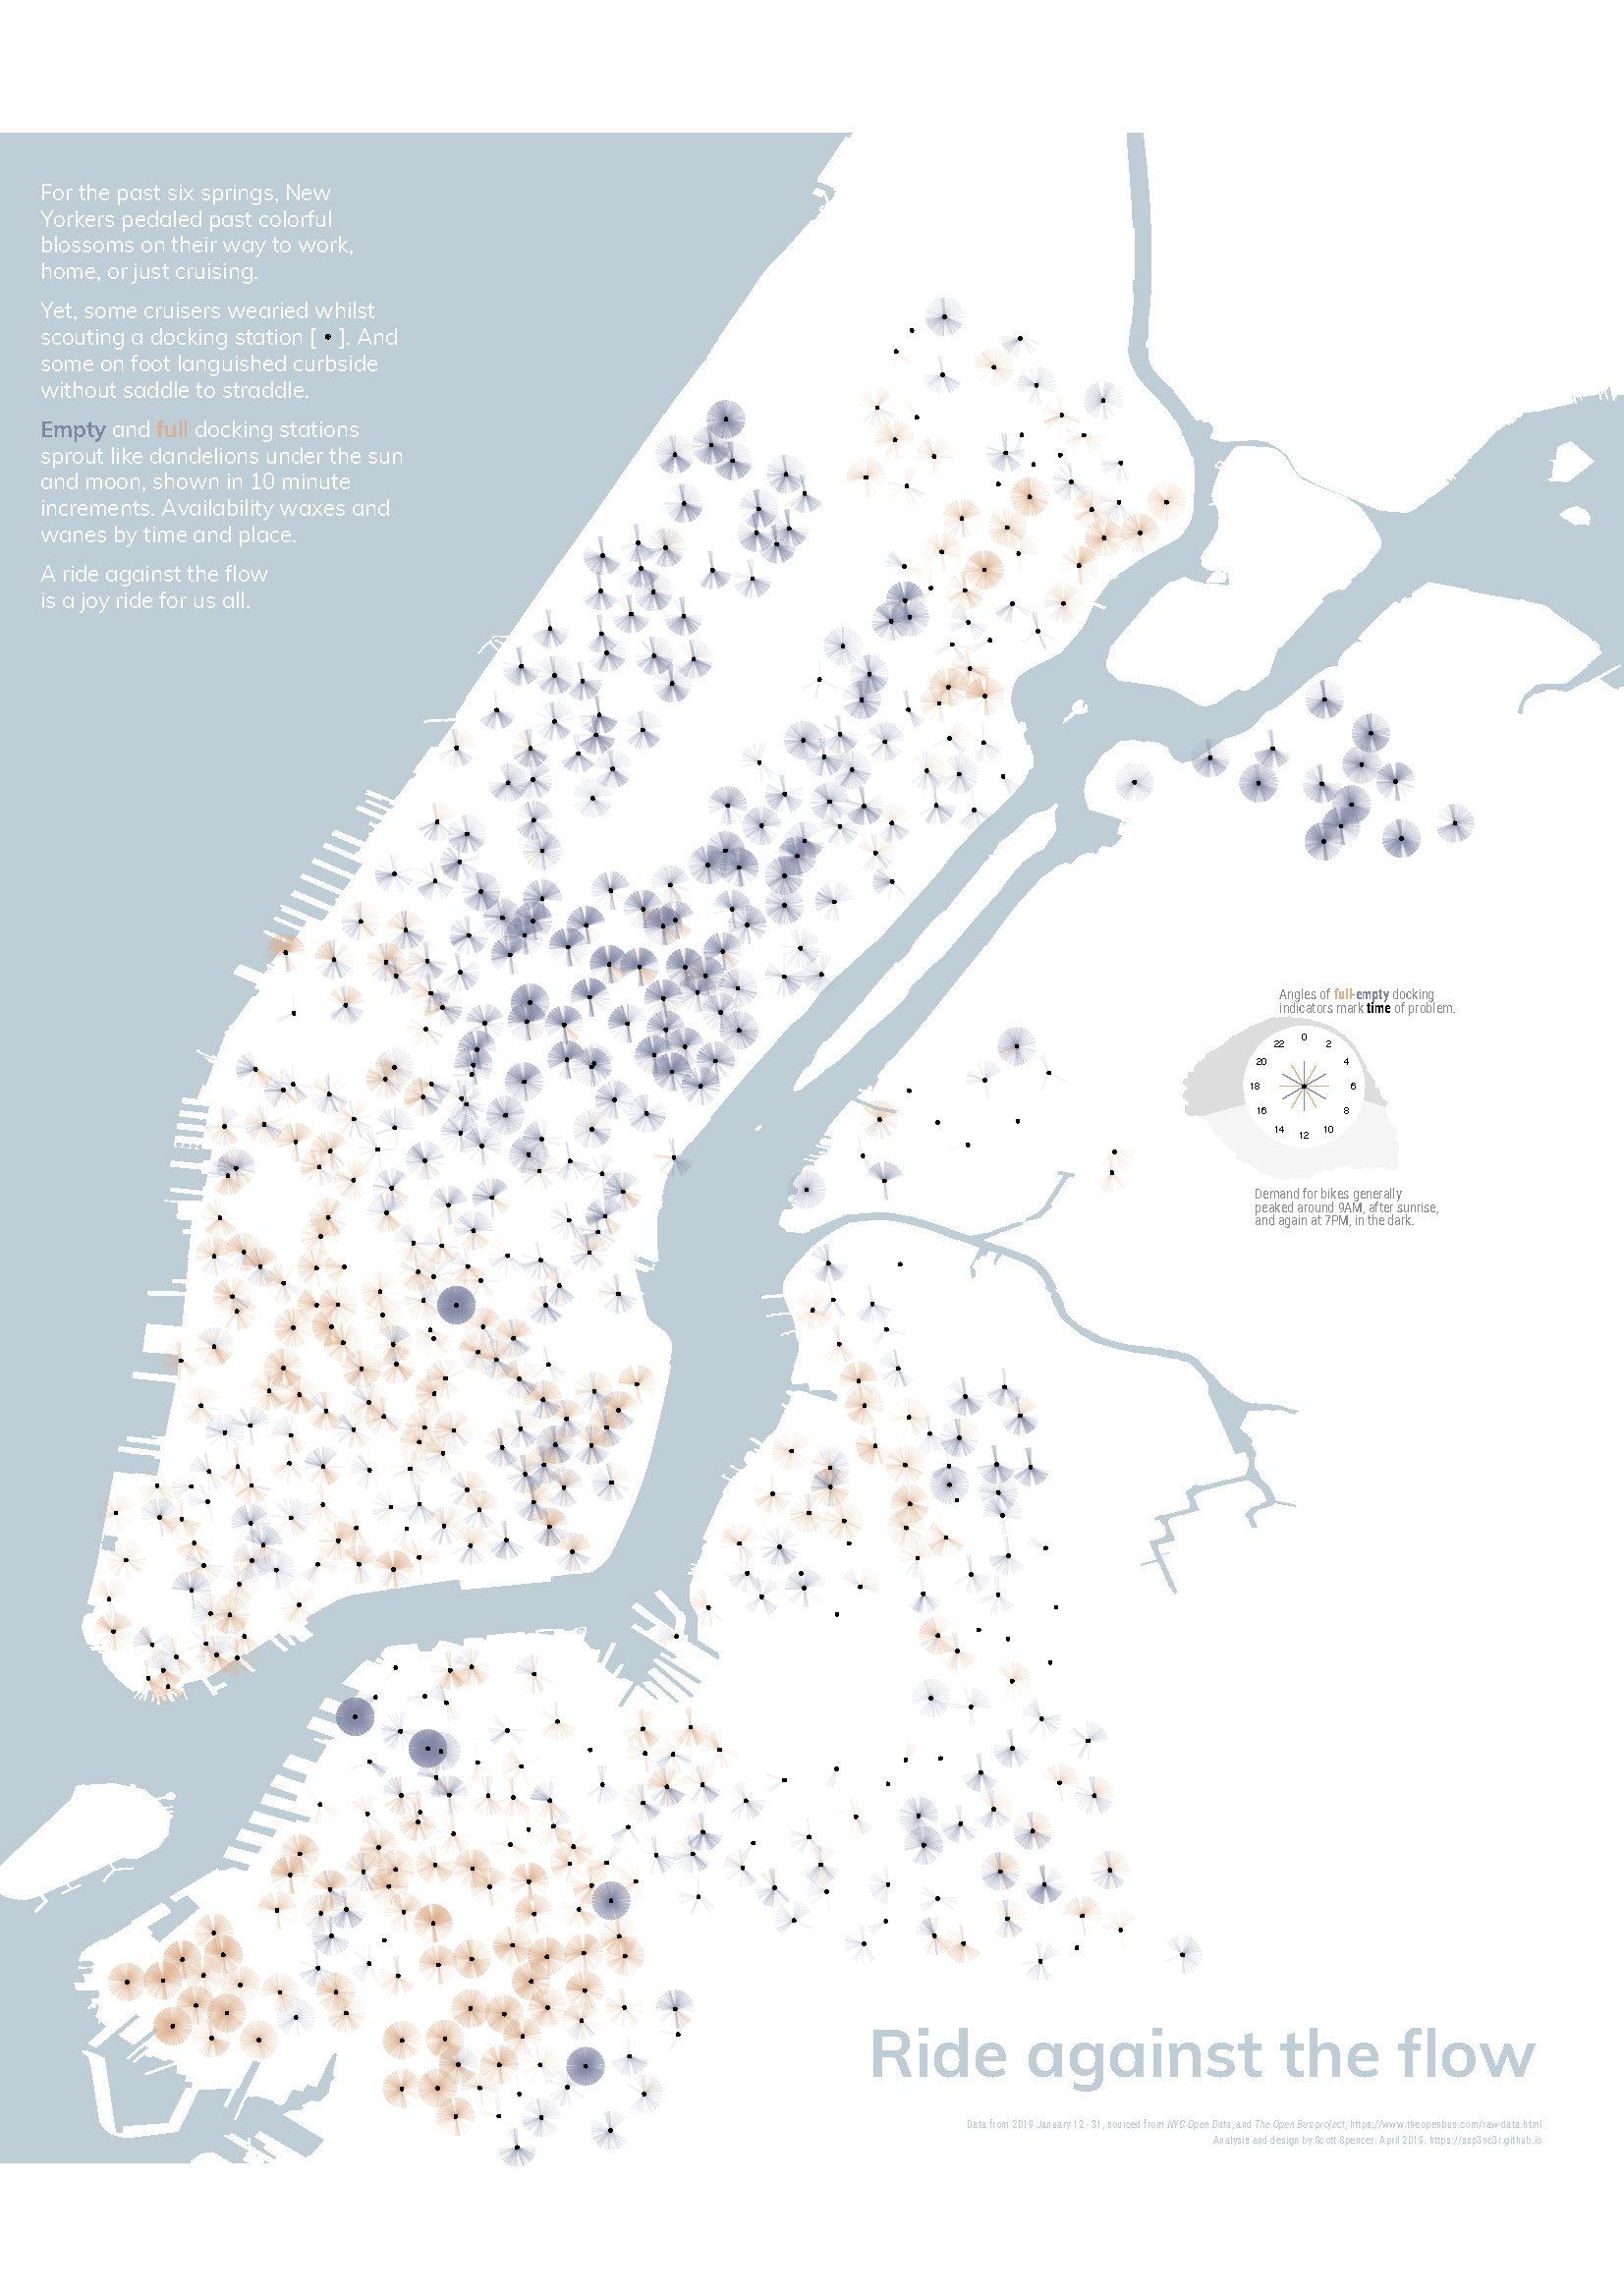
The visualization invites riders to explore bike and docking station availability for encouraging re-distribution for the NYC bike share. The data on trips and station availability are encoded in seven dimensions: space, time, bike and dock availability, rate of new rides per minute, and whether unavailability at a given time of day occurred multiple times.
I used the metaphor of unavailability as dandelions among flowers that riders travel through each spring, weeds that need fixing and a request: by riding against the flow—redistributing bikes—those riders are helping us all.
The entrant has supplied multiple files for this work:
-
CreditsScott Spencer
-
Award
-
Categories
-
See more


