
Live BMX Data Visualization by CLEVER°FRANKE
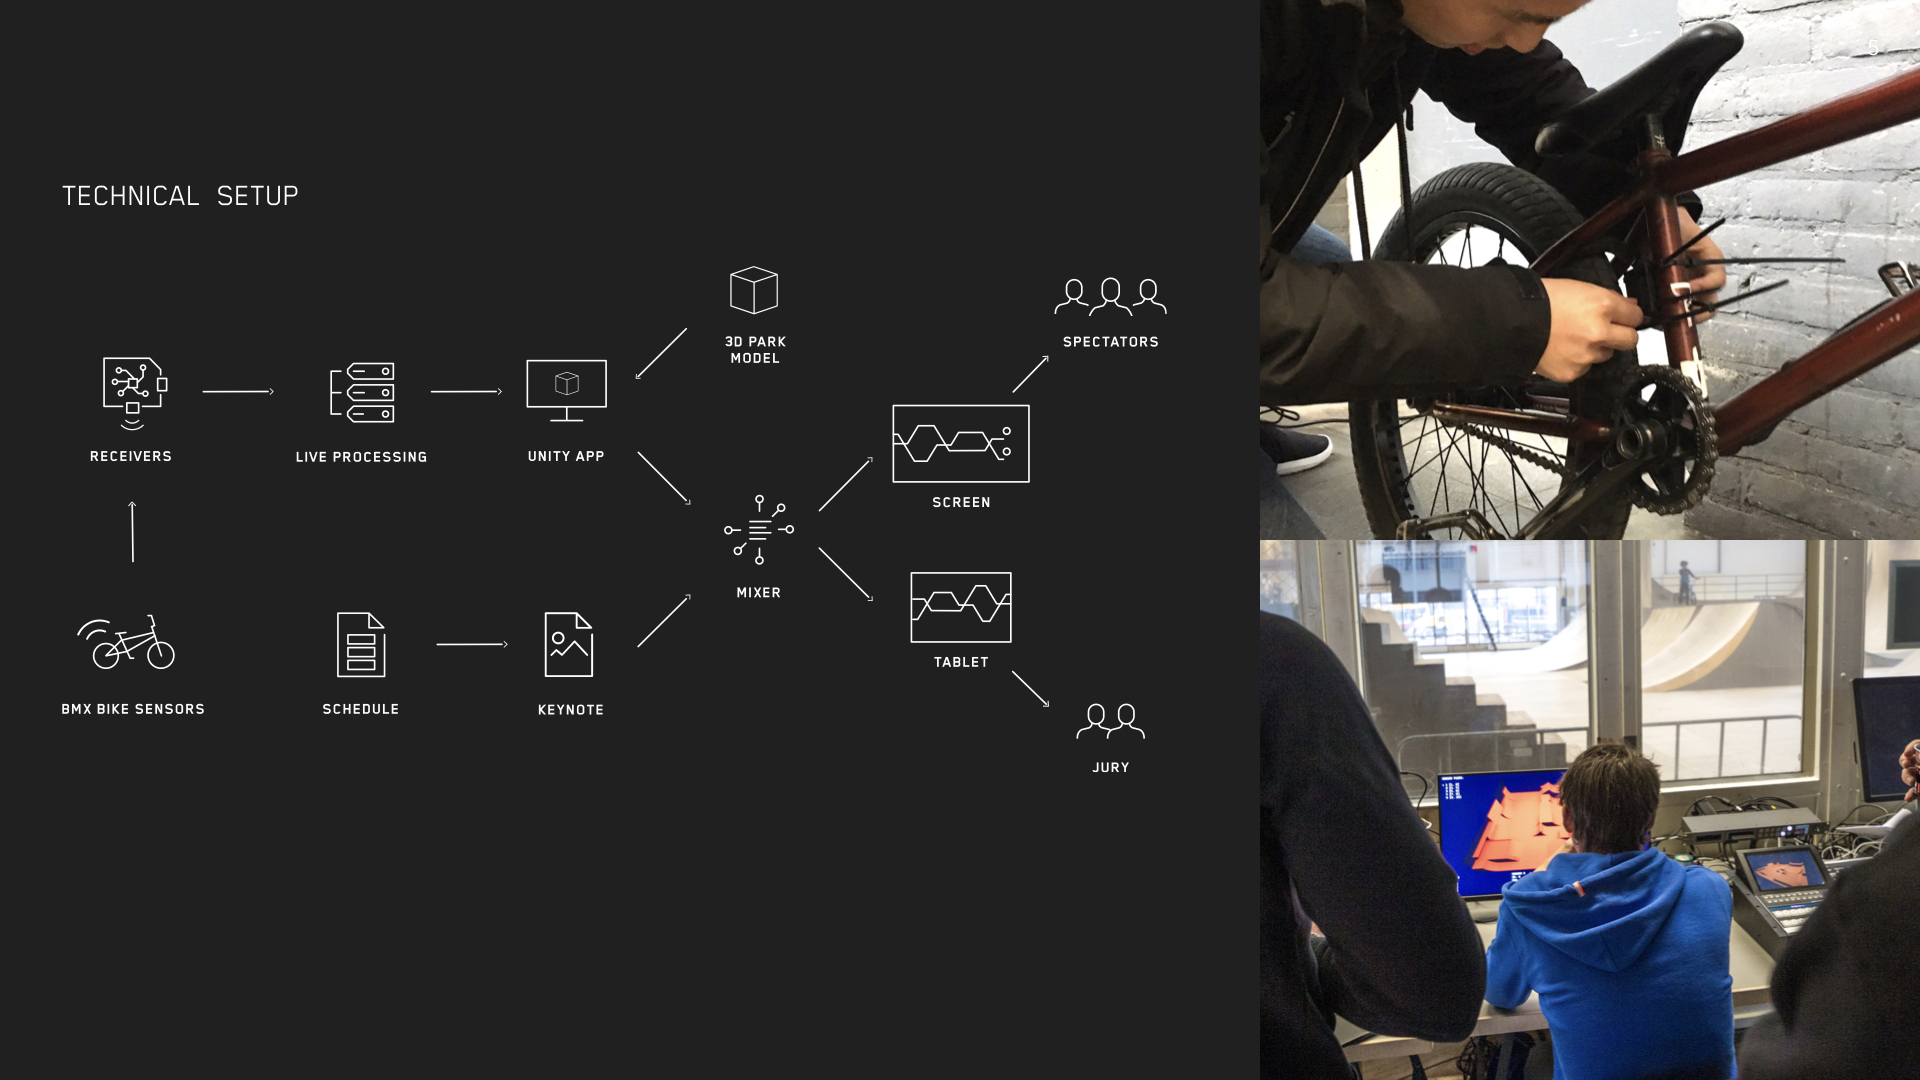
The Royal Dutch Cycling Federation wanted to attract more people to the fascinating sport of Freestyle BMX. Targeting live spectators and jury members, we developed an engaging platform that tracked the rider throughout their performance by using sensors, resulting in the first ever live data visualization of the BMX championship. The rider data is traced on the screen using a tire track print as a metaphor that has closer or wider dash patterns depending on the speed. Because this was the Dutch National Championships we used orange as a key color.
Pictures:
https://www.dropbox.com/sh/6v34ofbw6bt8ios/AAA4sLvpapfHQ1xZhMTak0u1a?dl=0
Video:
https://vimeo.com/315208847
The entrant has supplied multiple files for this work:
-
CreditsCreative Director: Thomas Clever, Gert Franke; Designer: Roel de Jonge, Joost Mommers; UX Designer: Joe Chrisman, Wouter van Dijk; Creative Development: Wilco Tomassen; Sensor data: Urban Sports Performance Centre
-
Award
-
Categories
-
See more


