Citygraph by Texty.org.ua
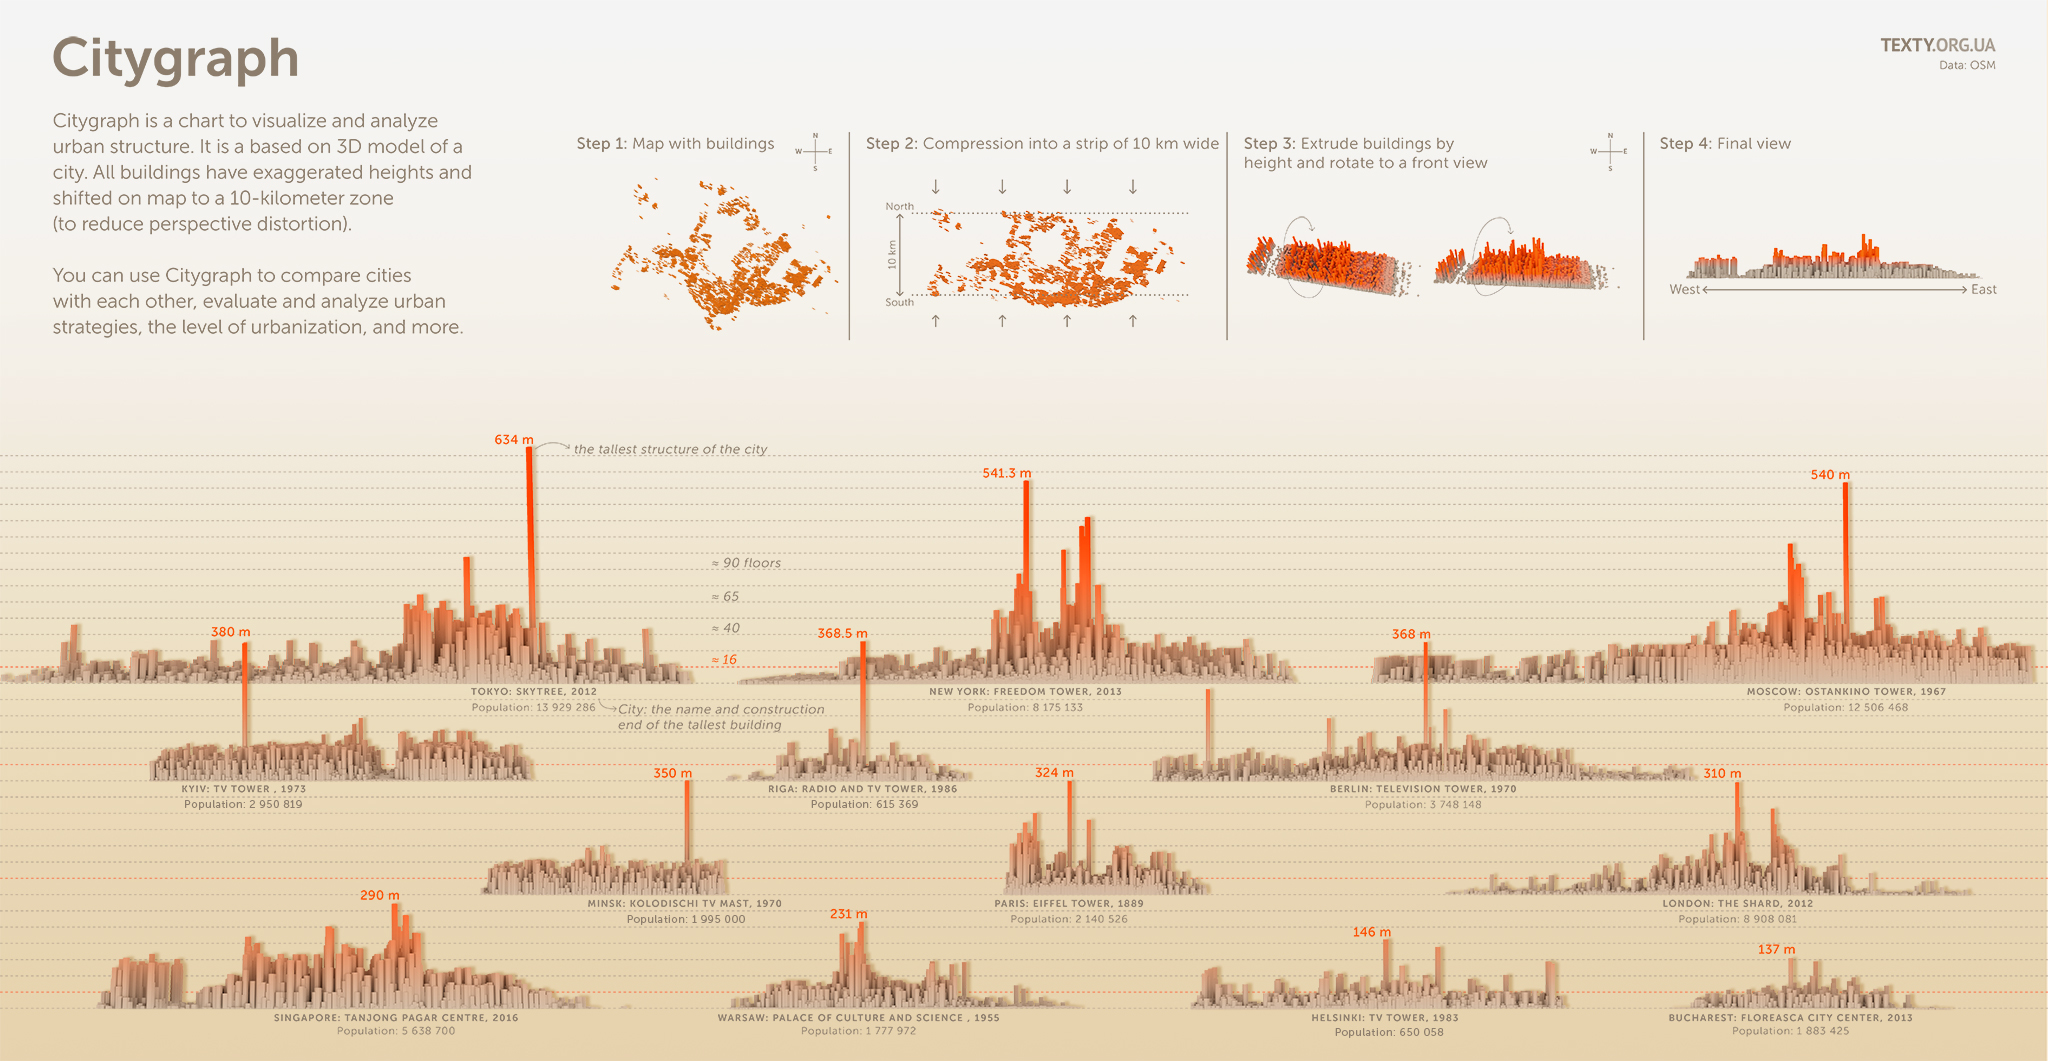
Citygraph is a chart to visualize and analyze urban structure. It is a based on 3D model of a city. All buildings have exaggerated heights and shifted on map to a 10-kilometer zone
(to reduce perspective distortion).
You can use Citygraph to evaluate and analyze urban strategies. Try to compare cities with each other: Tokyo and Singapore with New York and London; Berlin, Riga, Paris, Warsaw, Helsinki and Bucharest with Kyiv, Moscow and Minsk. Please see full image attached.
-
CreditsNadja Kelm, Peter Bodnar
-
Award
-
Categories
-
See more


