Venture Capital Investments: 1995-2011 by Natesh Daniel
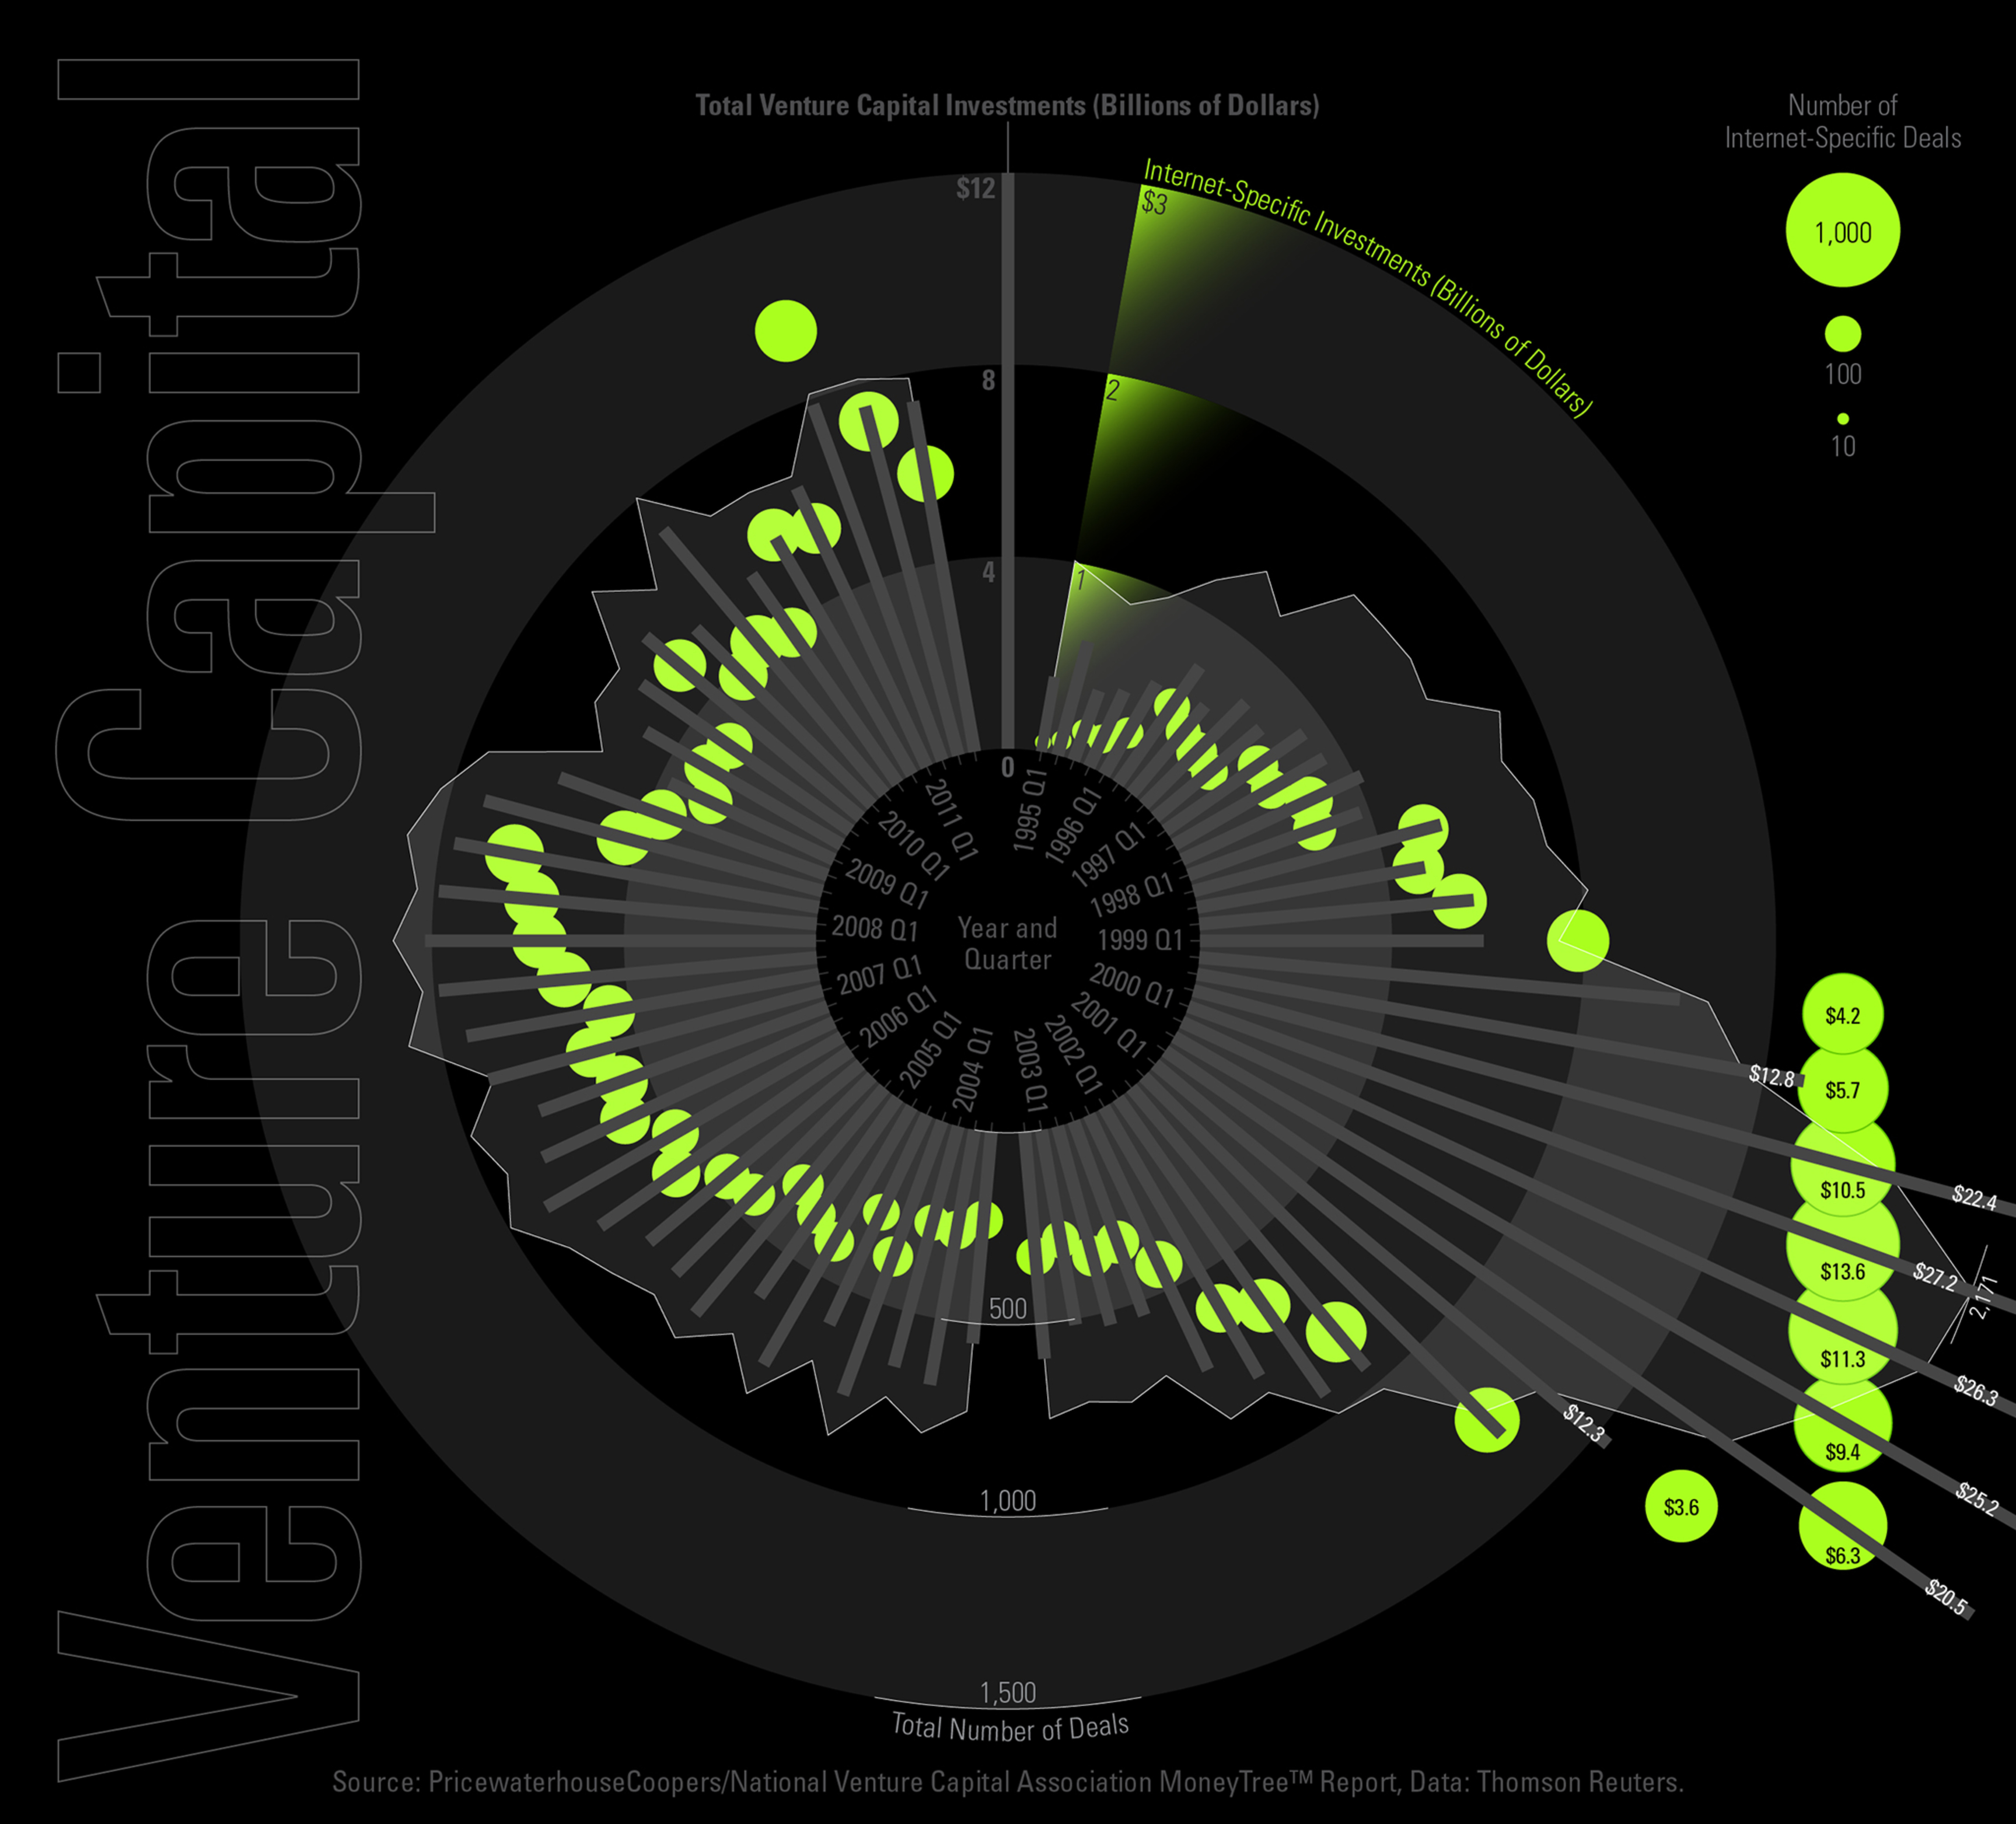
This data visualization is an exercise in creating a multivariate display using disparate but overlapping scales. Five variables are reported: quarter (of the year), total venture capital investments, total number of venture capital deals, total Internet-specific investments, and total number of Internet-specific deals. The scales for each variable (except time) do not relate but they follow a similar pattern.
The metaphor for this design relates to the dot-com era bubble (represented by the colored Internet investment bubbles and the bubble-shaped scales) and its burst in the year 2000, which is literally represented by data bars bursting out of the circular scales and extending off the chart.
The take-away from this visualization is that venture capital funding, though alive and well today, has never returned to the levels invested during the heyday of the dot-com boom.
The beauty in this visualization lies in the circular time-scale and its dark feel, which calls attention to the brightly-colored Internet-specific bubbles. Though this graphic reports linear trend data, its manipulation into a circular shape is unusual and defies the notion that trend data must be aligned horizontally in order for comparisons to be made accurately. Comparisons in this visualization are not as important as the pattern that emerged. The visual representation may be enjoyed for its own sake.
-
CreditsNatesh Daniel
-
Award
-
Categories


