
The dashboard provides an overview of a client's email marketing campaigns, with metrics on: the amount of sends, open rate, click rate, unsubscribe rate, response rate and revenue,
The...
-
 View projectThis story aims to show the different ways of looking at a survey. The survey is about the issues that voters think are the most important ahead of the elections in Sweden. The issue of crime...
 -
 View projectBioplex is an explorable collection of educational resources on complexity, ecology, systems thinking, and transdisciplinarity. The world needs a new paradigm of thought to tackle its increasingly...
 -
 View projectA handmade data object designed by three members of Starschema’s Data Visualization team; created purely for experimentation and outside work hours. The project was originally submitted to the Dear...
 -
 View projectThe conventional history of art is all of great men making great paintings, and displaying their works to a predominantly male audience. Imbalance, however, brings to light the recognition and...
 -
 View project
50 Black women have been killed by US police since 2015. Not one of the officers has been convicted.
For years, community leaders, activists, and journalists have called out the level at which the deaths of Black women by US police have gone under-reported. In 2020, there was a noticeable shift,... -
 View projectThe healthcare industry has seen an alarming rise in data breaches. 2023 has been considered the worst year so far in US healthcare with 160 million healthcare records exposed. The largest...
 -
 View projectSince 2014 The Visual Agency has worked with Brembo, a global leader in the design, development and production of braking systems, to help them tell the story of their involvement in the F1,...
 -
 View projectSouth America urges for more conservative governments. What showed first in Argentina and Brazil has been spreading across the continent. As political parties usually play a minor role in this...
 -
 View projectA visualization of the more than 100 confirmed planets discovered by NASA's Kepler mission.
 -
 View projectJordanian orphans and children given up at birth are expected to survive and thrive once they leave the care system. But in a country where family is everything, these children face relentless...
 -
 View projectWhat’s driving up burger prices? looked at Australia’s inflation figures through the lens of an everyday item. The Big Mac is both visually iconic and deeply interconnected with the broader...
 -
 View projectRegional Weather Myths explores several questions: Are our summers getting warmer and drier? Do real summers and winters even exist anymore? Are floods on the agenda in the region? It all started...
 -
 View projectA visual enquiry into the rape epidemic in India and the systematic dysfunction of the Indian justice system.
 -
 View projectGCP SL, the first UK REIT to focus on student accommodation, celebrated their fifth birthday in 2018. We created a chronological timeline graphic to showcase the company’s achievements since...
 -
 View projectThis incredible project will immerse you in the wild world of the Chornobyl Zone. You can see and even hear the voices of animals and birds—from Przewalski's horses to the Ukrainian brook lamprey....
 -
 View projectColor research in movies. We held a survey concerning colors presented in several films by means of calculating the amount of one or another color shade appearing during the whole movie. That's how...
 -
 View projectA map that visualizes at the percentage of population with acess to broadband internet alongside the number of primary care physicians per capita for each county in 50 states and the District of...
 -
 View projectNBA's leading scorer: LeBron James has surpassed 38,387 points, the record set by Kareem Abdul-Jabbar over 30 years ago. Graphics team members Mitchell Thorson and Ramon Padilla partnered with Jeff...
 -
 View projectAs Ukraine’s counteroffensive finally got underway, the pace of the early news came thick and fast. Between stalled Ukrainian attacks and what they revealed about the depth of Russia’s defensive...
 -
 View project‘Renewable Rhythms’ is a dynamic data-painting installation created by the generative artist collective The “What If” Project, led by Daniele Giannini, an IT professional at Terna, the Italian...
 -
 View projectThis animated web graphic is part of a 5 part information graphic series for Siemens Healthcare, mentioning 5 major trends in global healthcare, one per piece. The artwork ‘Facing the paradigm...
 -
 View projectThis information visualization aims to make the ordering process fun and faster at the "Tuck Shop" (the university canteen), for all those who wish to order (but primarily for students!). The...
 -
 View projectUsing the 2012 Agricultural Census data, we sought to answer three related questions about U.S. Farm Size: 1. Do small farms really have greater crop diversity? 2. Do government payments...
 -
 View projectCan sound and visuals be used in tandem to accurately convey what chronic migraines feel like to someone who has never had the experience? What can a migraine look like? Sound like? Is there a...
 -
 View projectThe interactive scientific poster "Explore The Ocean" of the GEOMAR Helmholtz Centre for Marine Research explains complex marine science with a multi-touch display right on board the Hapag-Lloyd...
 -
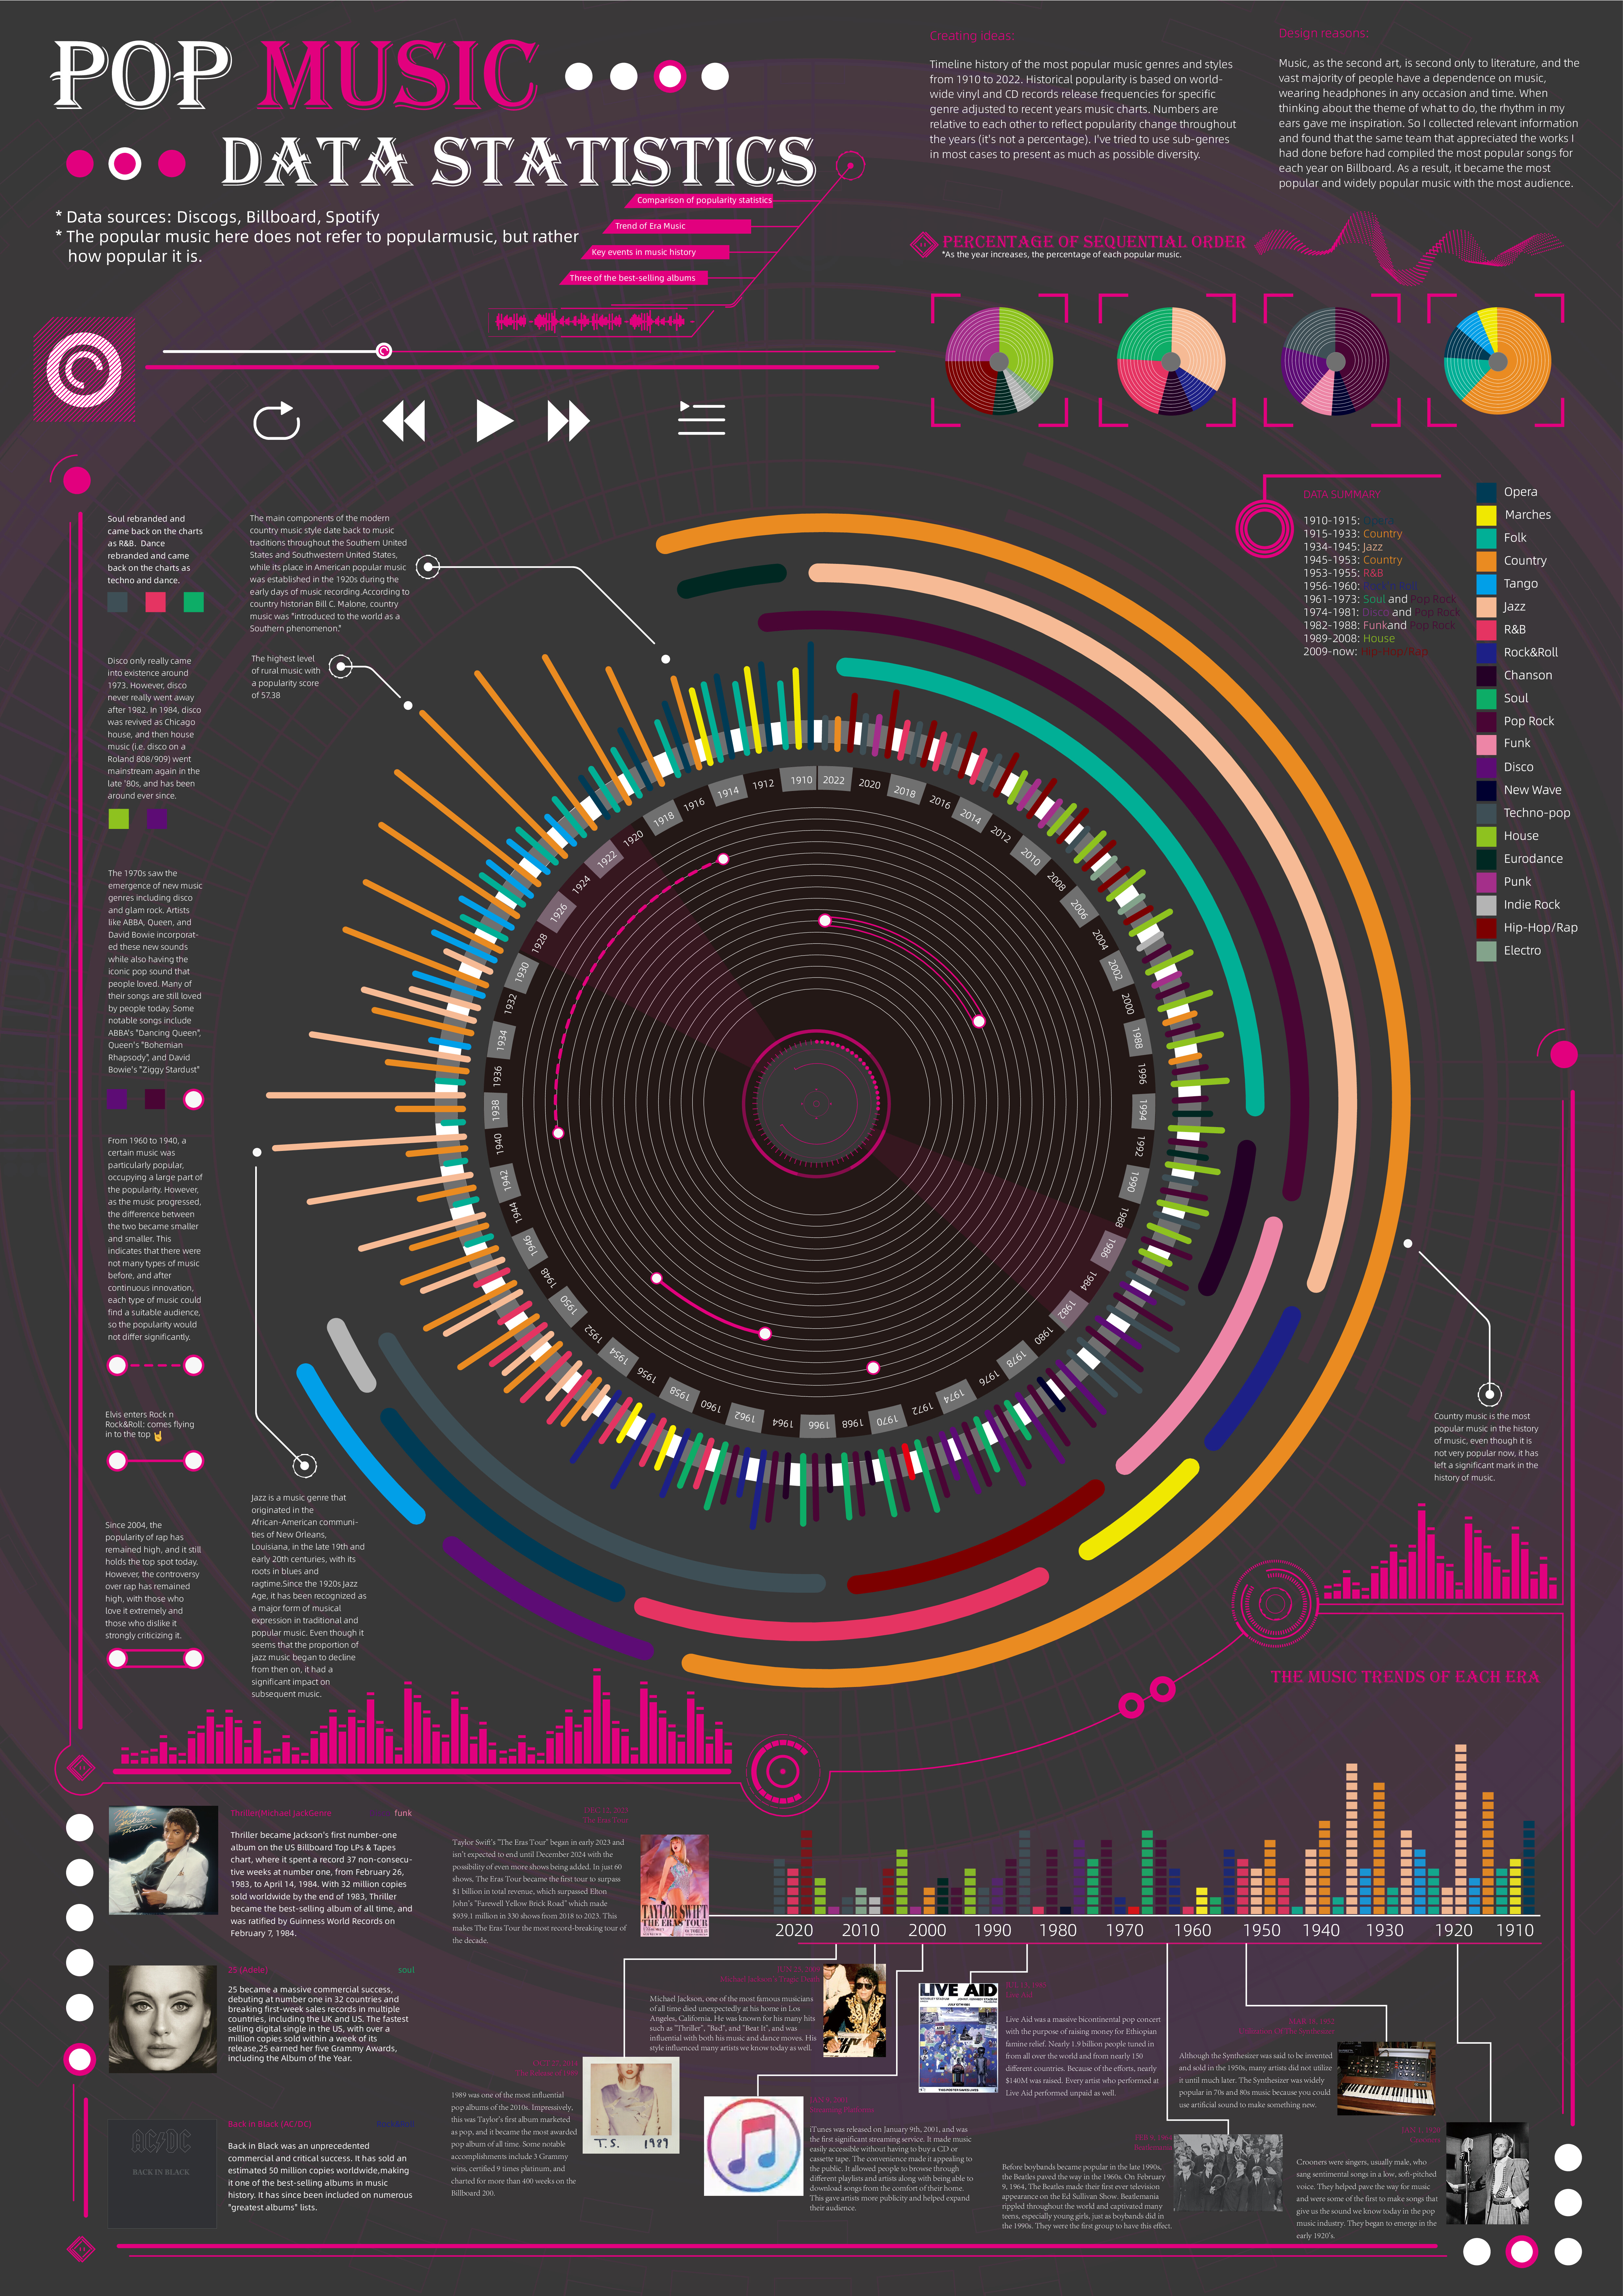
 View projectTimeline history of the most popular music genres and stylesfrom 1910 to 2022.Historical popularityis based on world-wide vinyl and CD records release frequencies for specificgenre adjusted to...
 -
 View projectA visual story going over on some common dishes frequently consumed during Lunar New Year in Taiwan and related symbolisms. One of the many hallmarks of this 16-day celebration is the feasting...

