Wikiflows - One Year on Wikipedia by Valerio Pellegrini
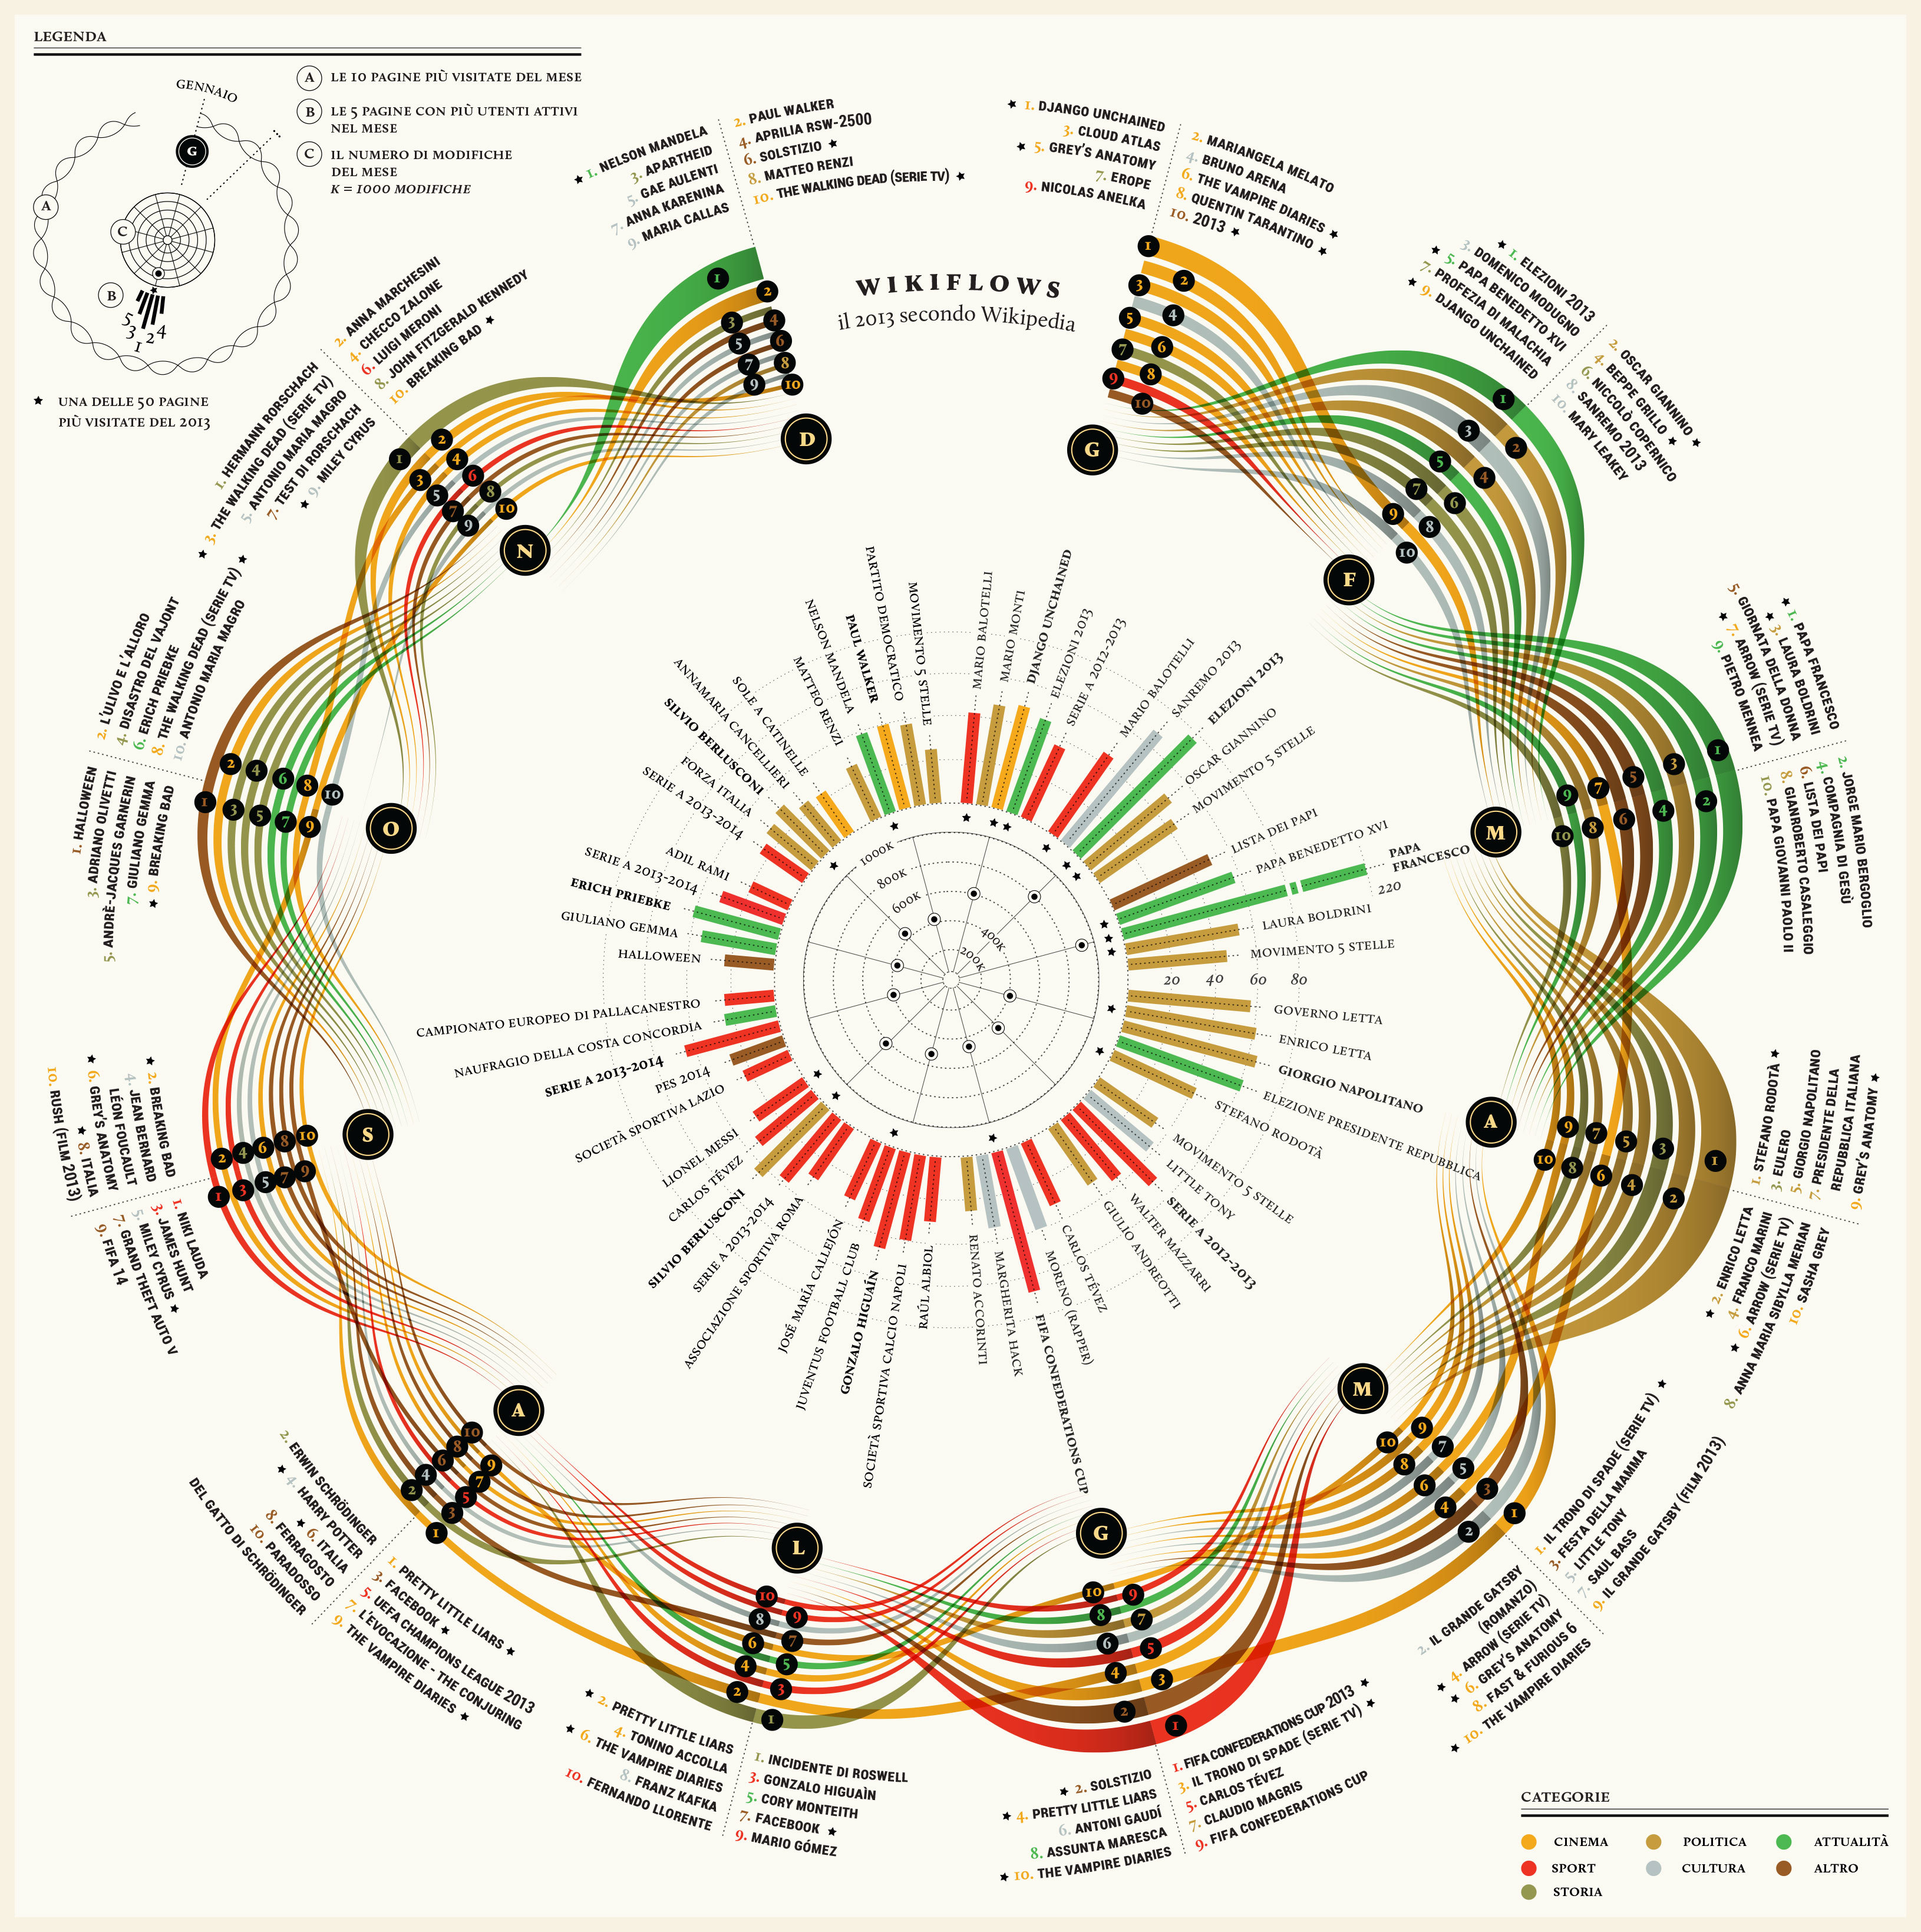
Due to its popularity and to its policy that allows anyone to edit pages, Wikipedia often becomes a battlefield, where different factions try to impose their view on controversial topics (hopefully) trying to find a compromise. All these activities generate a huge amount of data that the encyclopedia collects and makes available to everyone. For this visualization we asked: which were the most visited pages during 2013? Which were the most edited? What’s the overall picture of one year of history looked through Wikipedia? The visualization is divided into three layers: inside, the overall production on it.wiki in terms of edits; on the second level, the five pages with most editors and on the outer one, the most visited pages represented as flows. The colours represent topic categories: cinema, politics, current events, sport, music and culture, miscellaneous, history. What emerges from the Italian version of Wikipedia is a pattern of current events, tv series, famous deaths and –believe it or not- Google Doodles topics.
-
CreditsValerio Pellegrini, Michele Mauri
-
Award
-
Categories


