Maps Soil BFH - Quick Soil Profile Viewer by Bern University of Applied Sciences
Soil data is sampled at point locations (e.g. machine drill, excavation). For each location numerous attributes are recorded and often samples taken that are analyzed for a multitude of properties in the laboratory. To date soil point data is distributed as spreadsheets with large numbers of columns or classically viewed on soil profile sheets covering a full page. So far, brief overviews of soil distribution in a landscape were hampered by soil data applications requiring multiple clicks to access the desired information at just one point location.
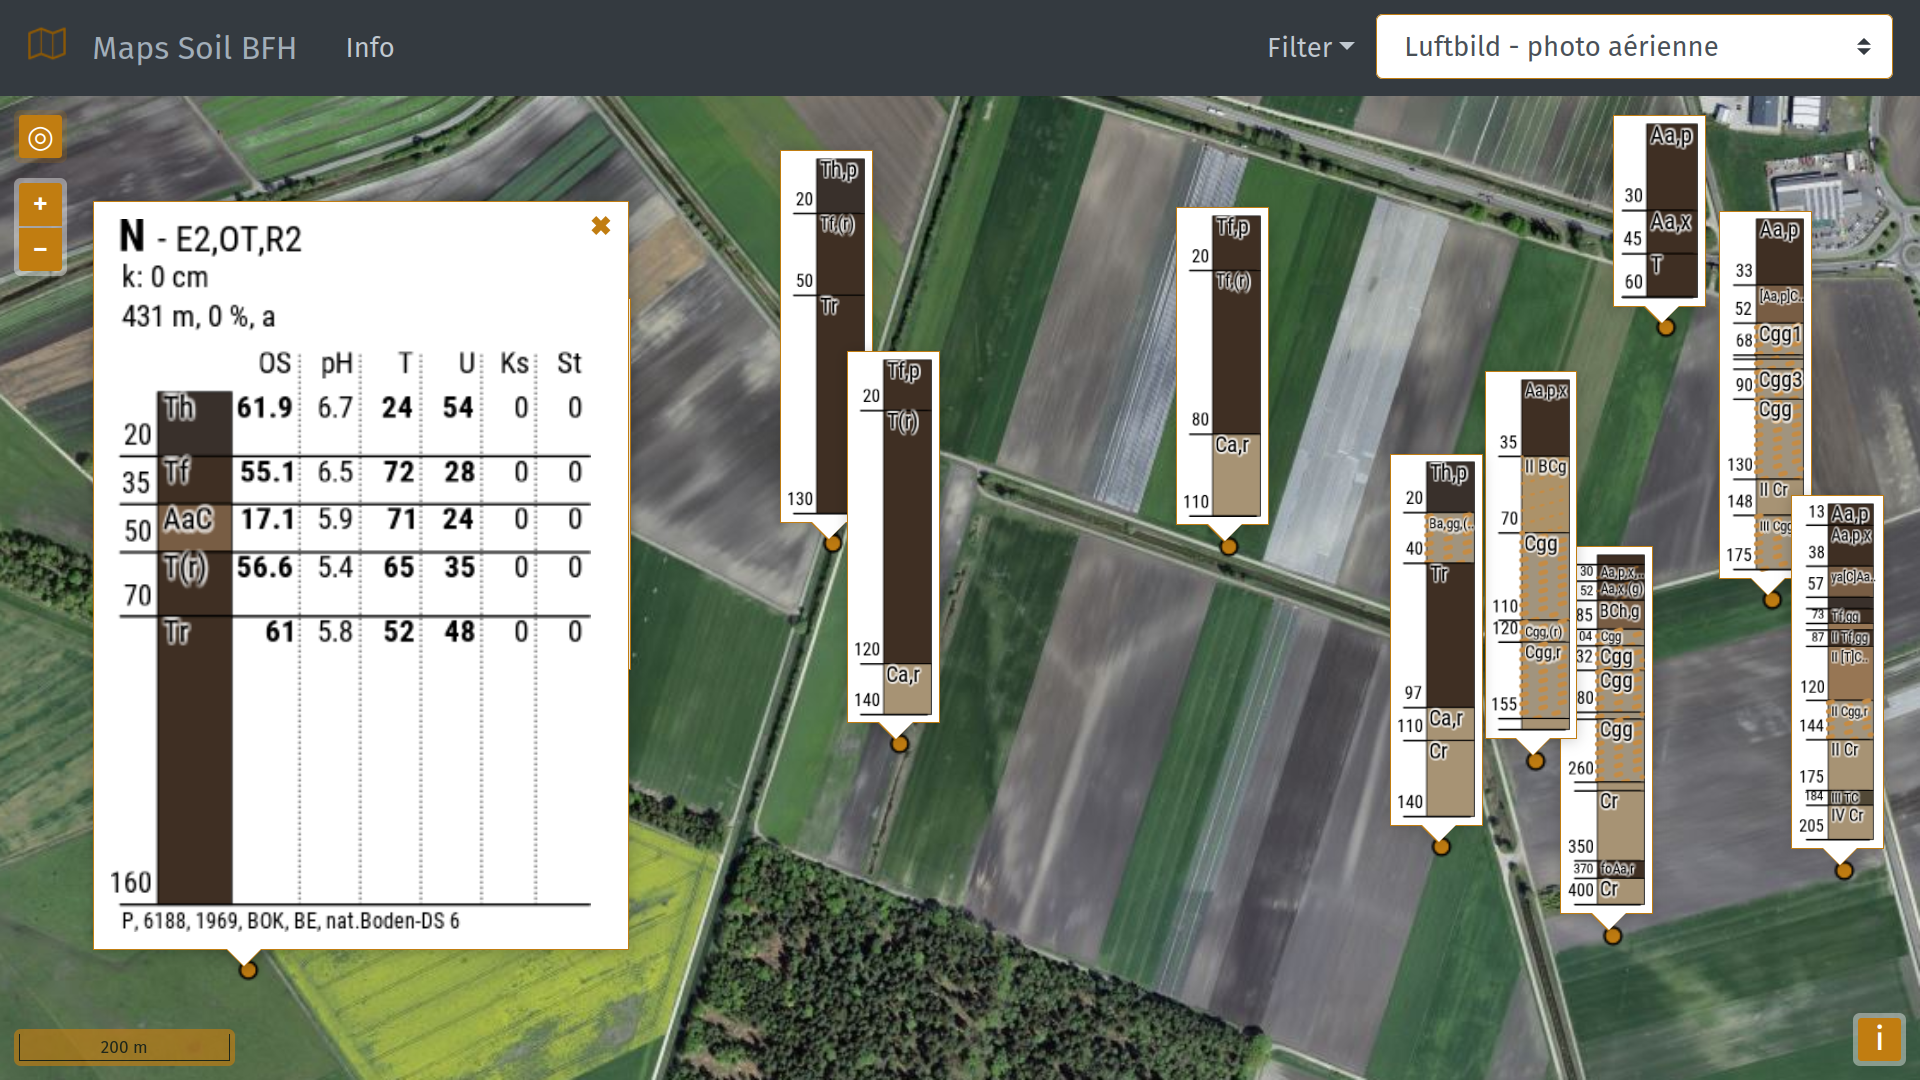
In the current version of Maps Soil BFH schematic graphics for more than 30'000 point locations were automatically generated. These graphics summarize high-dimensional soil point information to convey information at first glance. More than 30 columns of the original spreadsheet are displayed on larger graphics available on mouse click from a miniature graphic. Information is shown for each soil horizon (depth layers) and differentiated by laboratory measurement (bold) or field estimation (regular font) for each value. Staff trained in soil science can get an immediate understanding of soils throughout the landscape by interacting with the map.
The web application is designed as a prototype to evaluate and discuss needs of soil staff and surveyors within Switzerland. More soil sampling locations are included if new data becomes publicly available.
The target audience are soil scientists, surveyors and specialized administrative bodies taking decisions based on soil information. The content is therefore not yet made understandable for a lay audience. Expansion to other countries is straightforward as structure of recorded soil data is very similar elsewhere and most of the background maps are available globally.
-
CreditsPeter Trachsel, contribution to R code for automatic generation of soil profile graphics
-
Award
-
Categories
-
See more


