The Soap Data- data of Domestic Water Consumption by London College of Communication, UAL
Displaying in an internal class exhibition, a series of data visualisations are displayed to reveal the story of water consumption in households. Soap is chosen to be the media and main theme of the data visualisation as it is closely linked to household sanitizing.
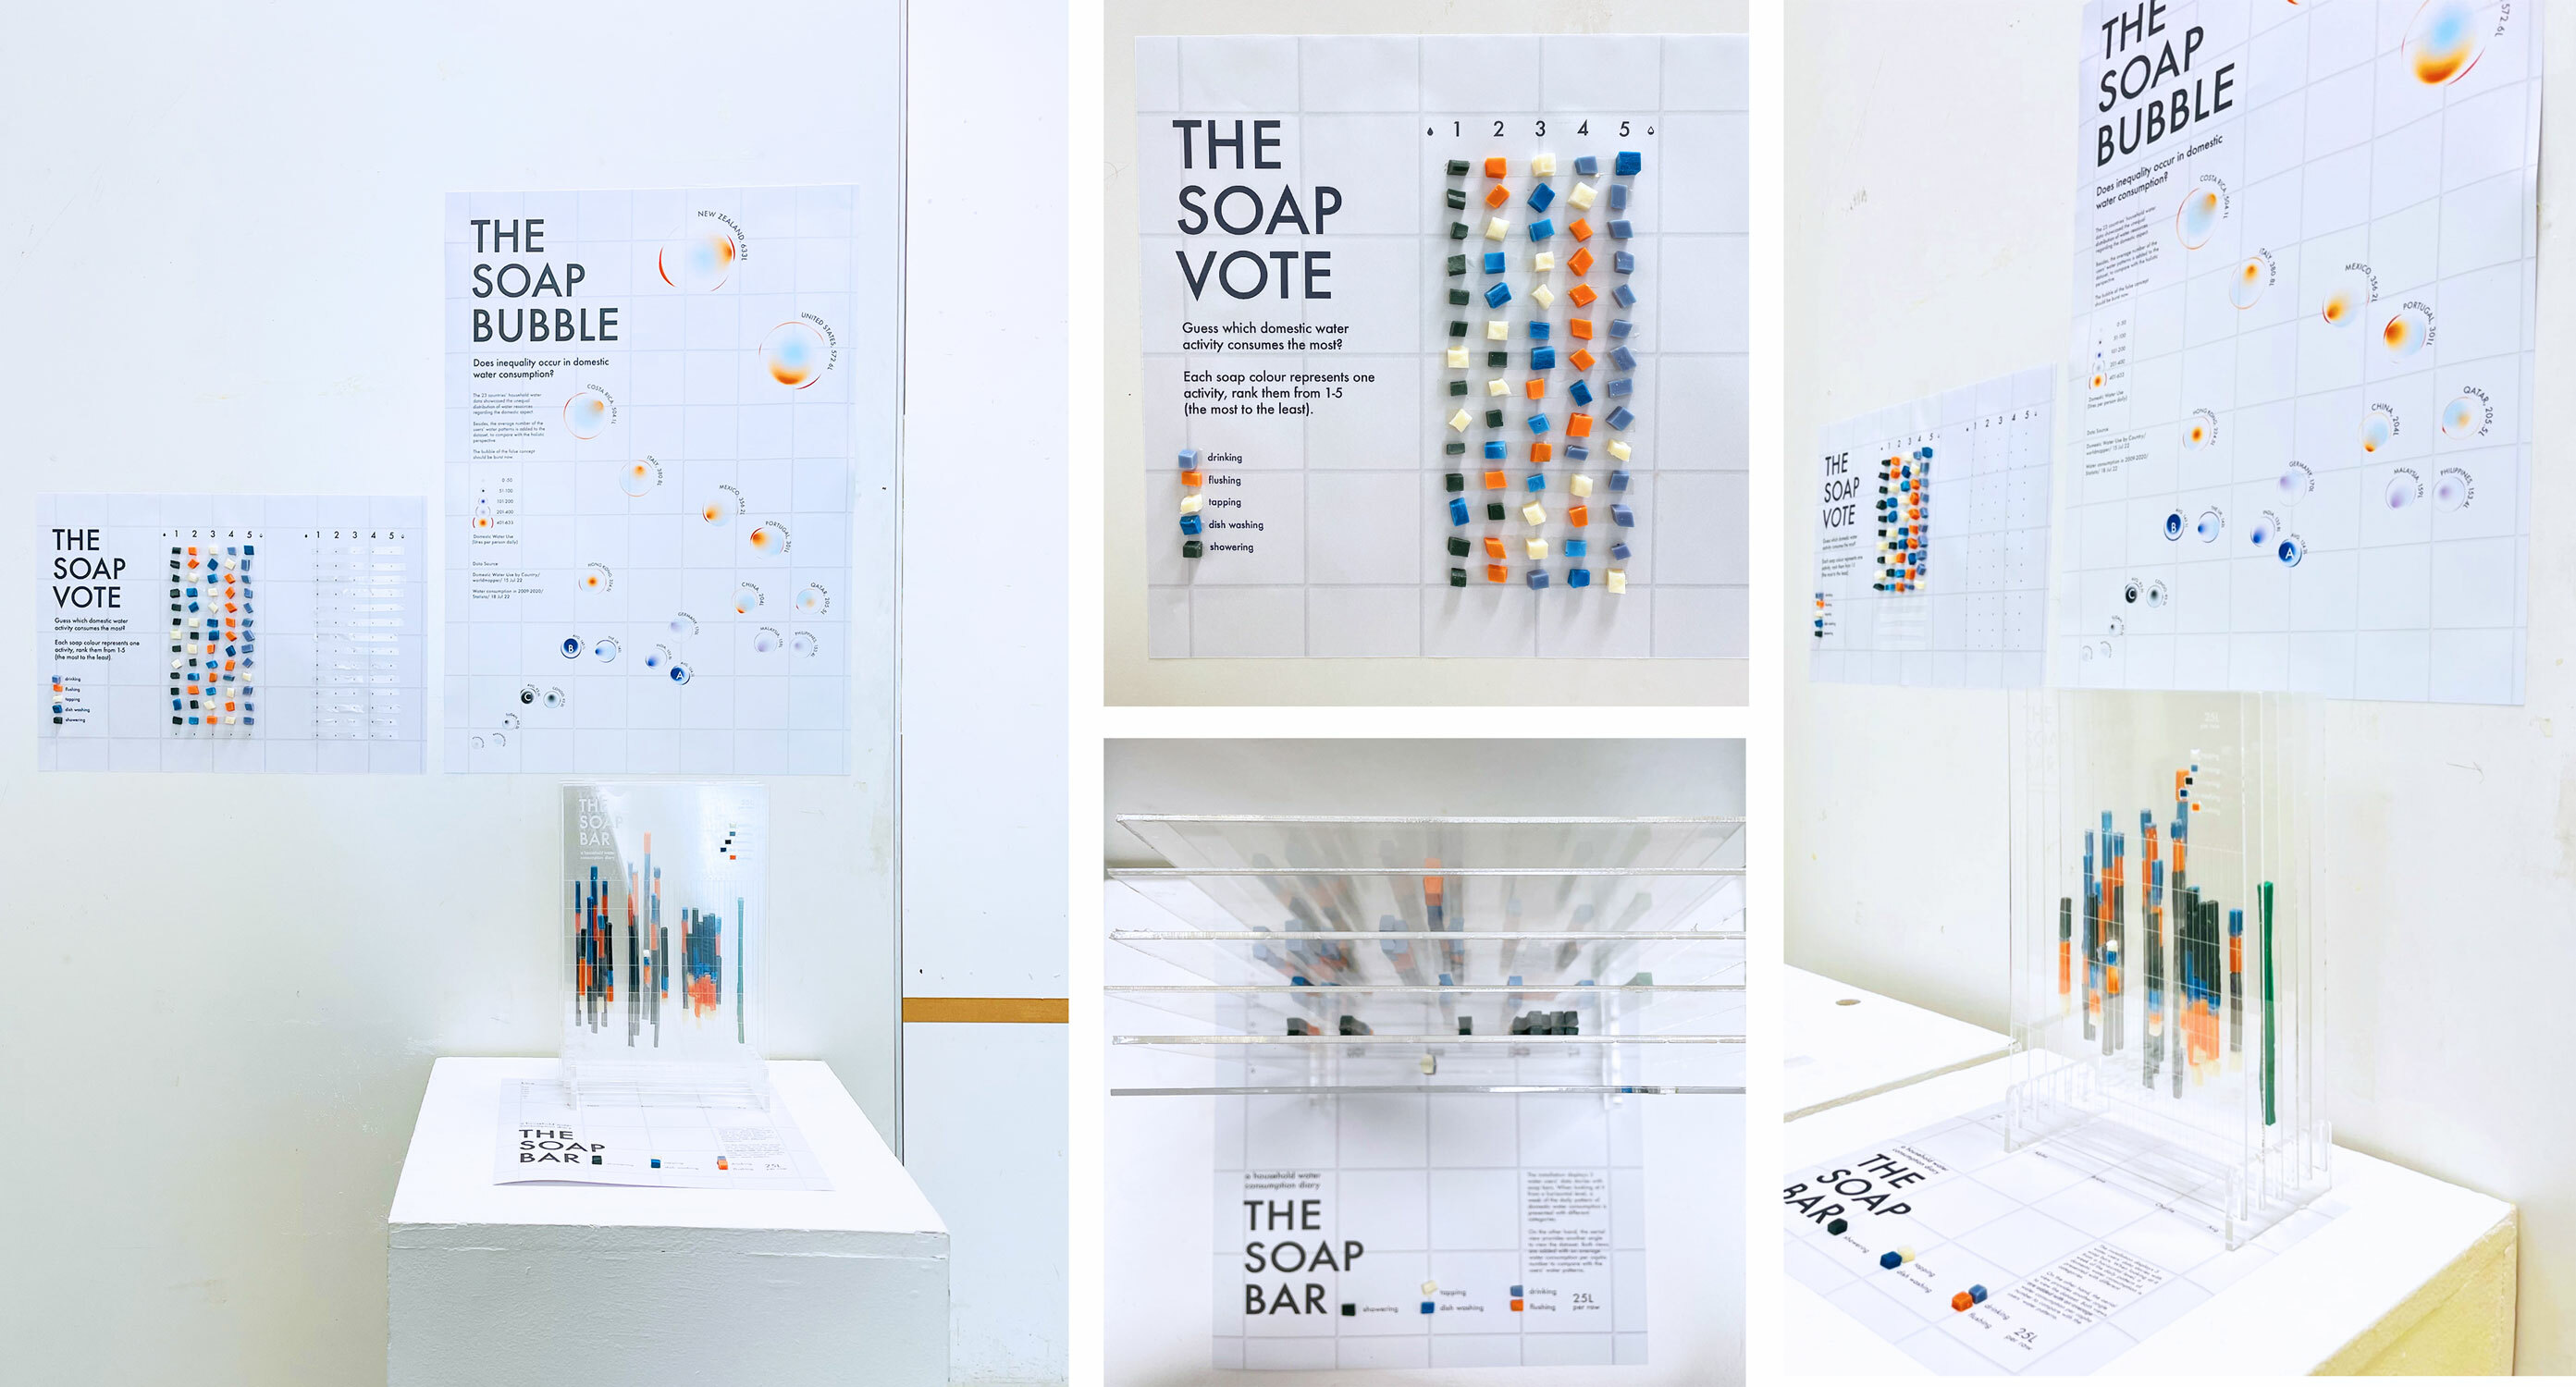
The Soap Bar:
The installation presents 3 water users’ data stories with crafted soap bars in a week. Besides showing the overall amount of used water, participants are asked to provide the number of times or duration of different water activities at their homes. The data is then separated into 5 layers of transparent acrylic board with the water amount the participants have used each day. This allows audiences to closely review each of the water activities from the horizontal level, as well as the daily pattern of domestic water consumption of each person in an ariel view. Both views are added with an average water consumption per capita number to compare with the users’ water patterns.
The Soap Bubble:
The poster displays 23 countries’ household water data showcasing the unequal distribution of water resources regarding the domestic aspect. The average number of the users‘ water patterns from the Soap Bar installation, is also added to the dataset to compare with the holistic perspective.
The Soap Vote:
Lastly, a poster is created to allow audiences to express their perception of the amount of water used in different categories. Small pieces of soap are provided for them to attach to the poster. It adds a fun part to the series and allows people to guess which kinds of water activities consume water the most.
-
Credits
-
Award
-
Categories
-
See more


