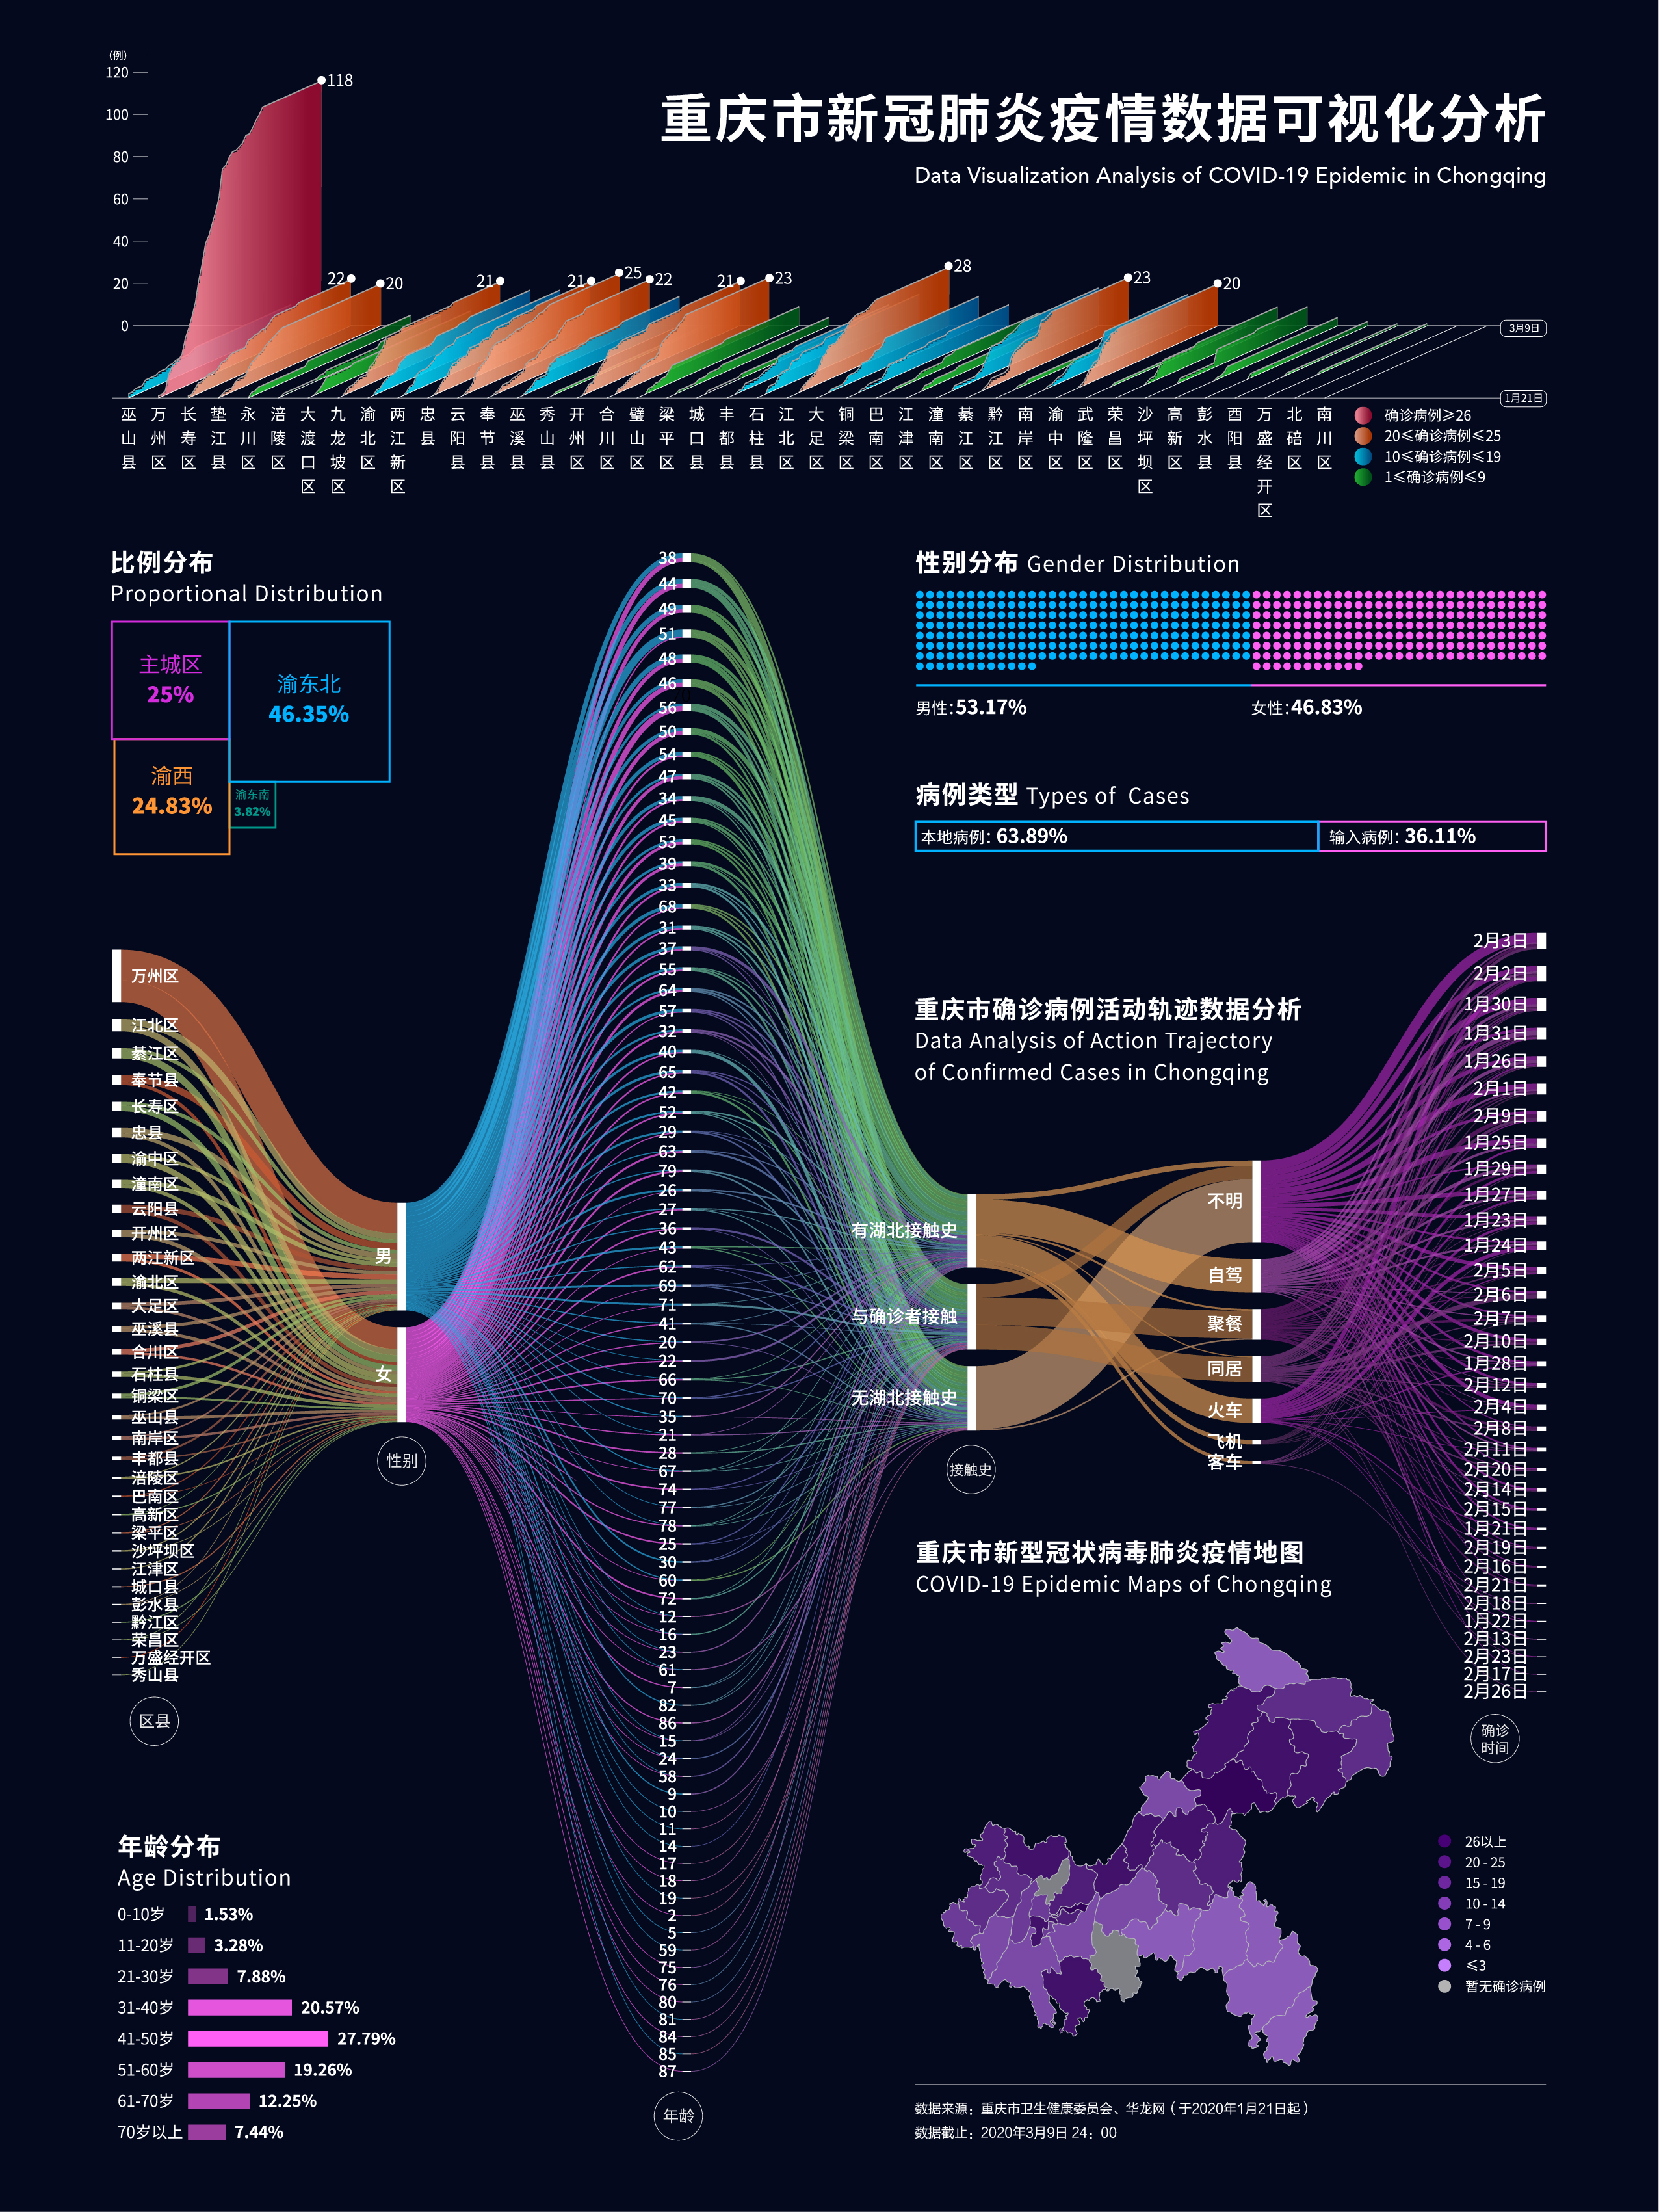
Data Visualization Analysis of COVID-19 Epidemic in Chongqing by Sichuan Fine Arts Institute
By the end of 2019, the new coronavirus pneumonia began to spread rapidly. As of March 9,2020, a total of 576 confirmed cases had been reported in Chongqing. In order to present the situation of infection in Chongqing more clearly, the author collected samples from the published data and analyzed them twice, using such information visualization methods as the Sangi energy diffluence map, the layered area map and the data chart, the analysis results of the infection data of new coronavirus pneumonia in Chongqing were presented directly.
-
Credits
-
Award
-
Categories
-
See more


