Newspaper circulation by National Institute of Design
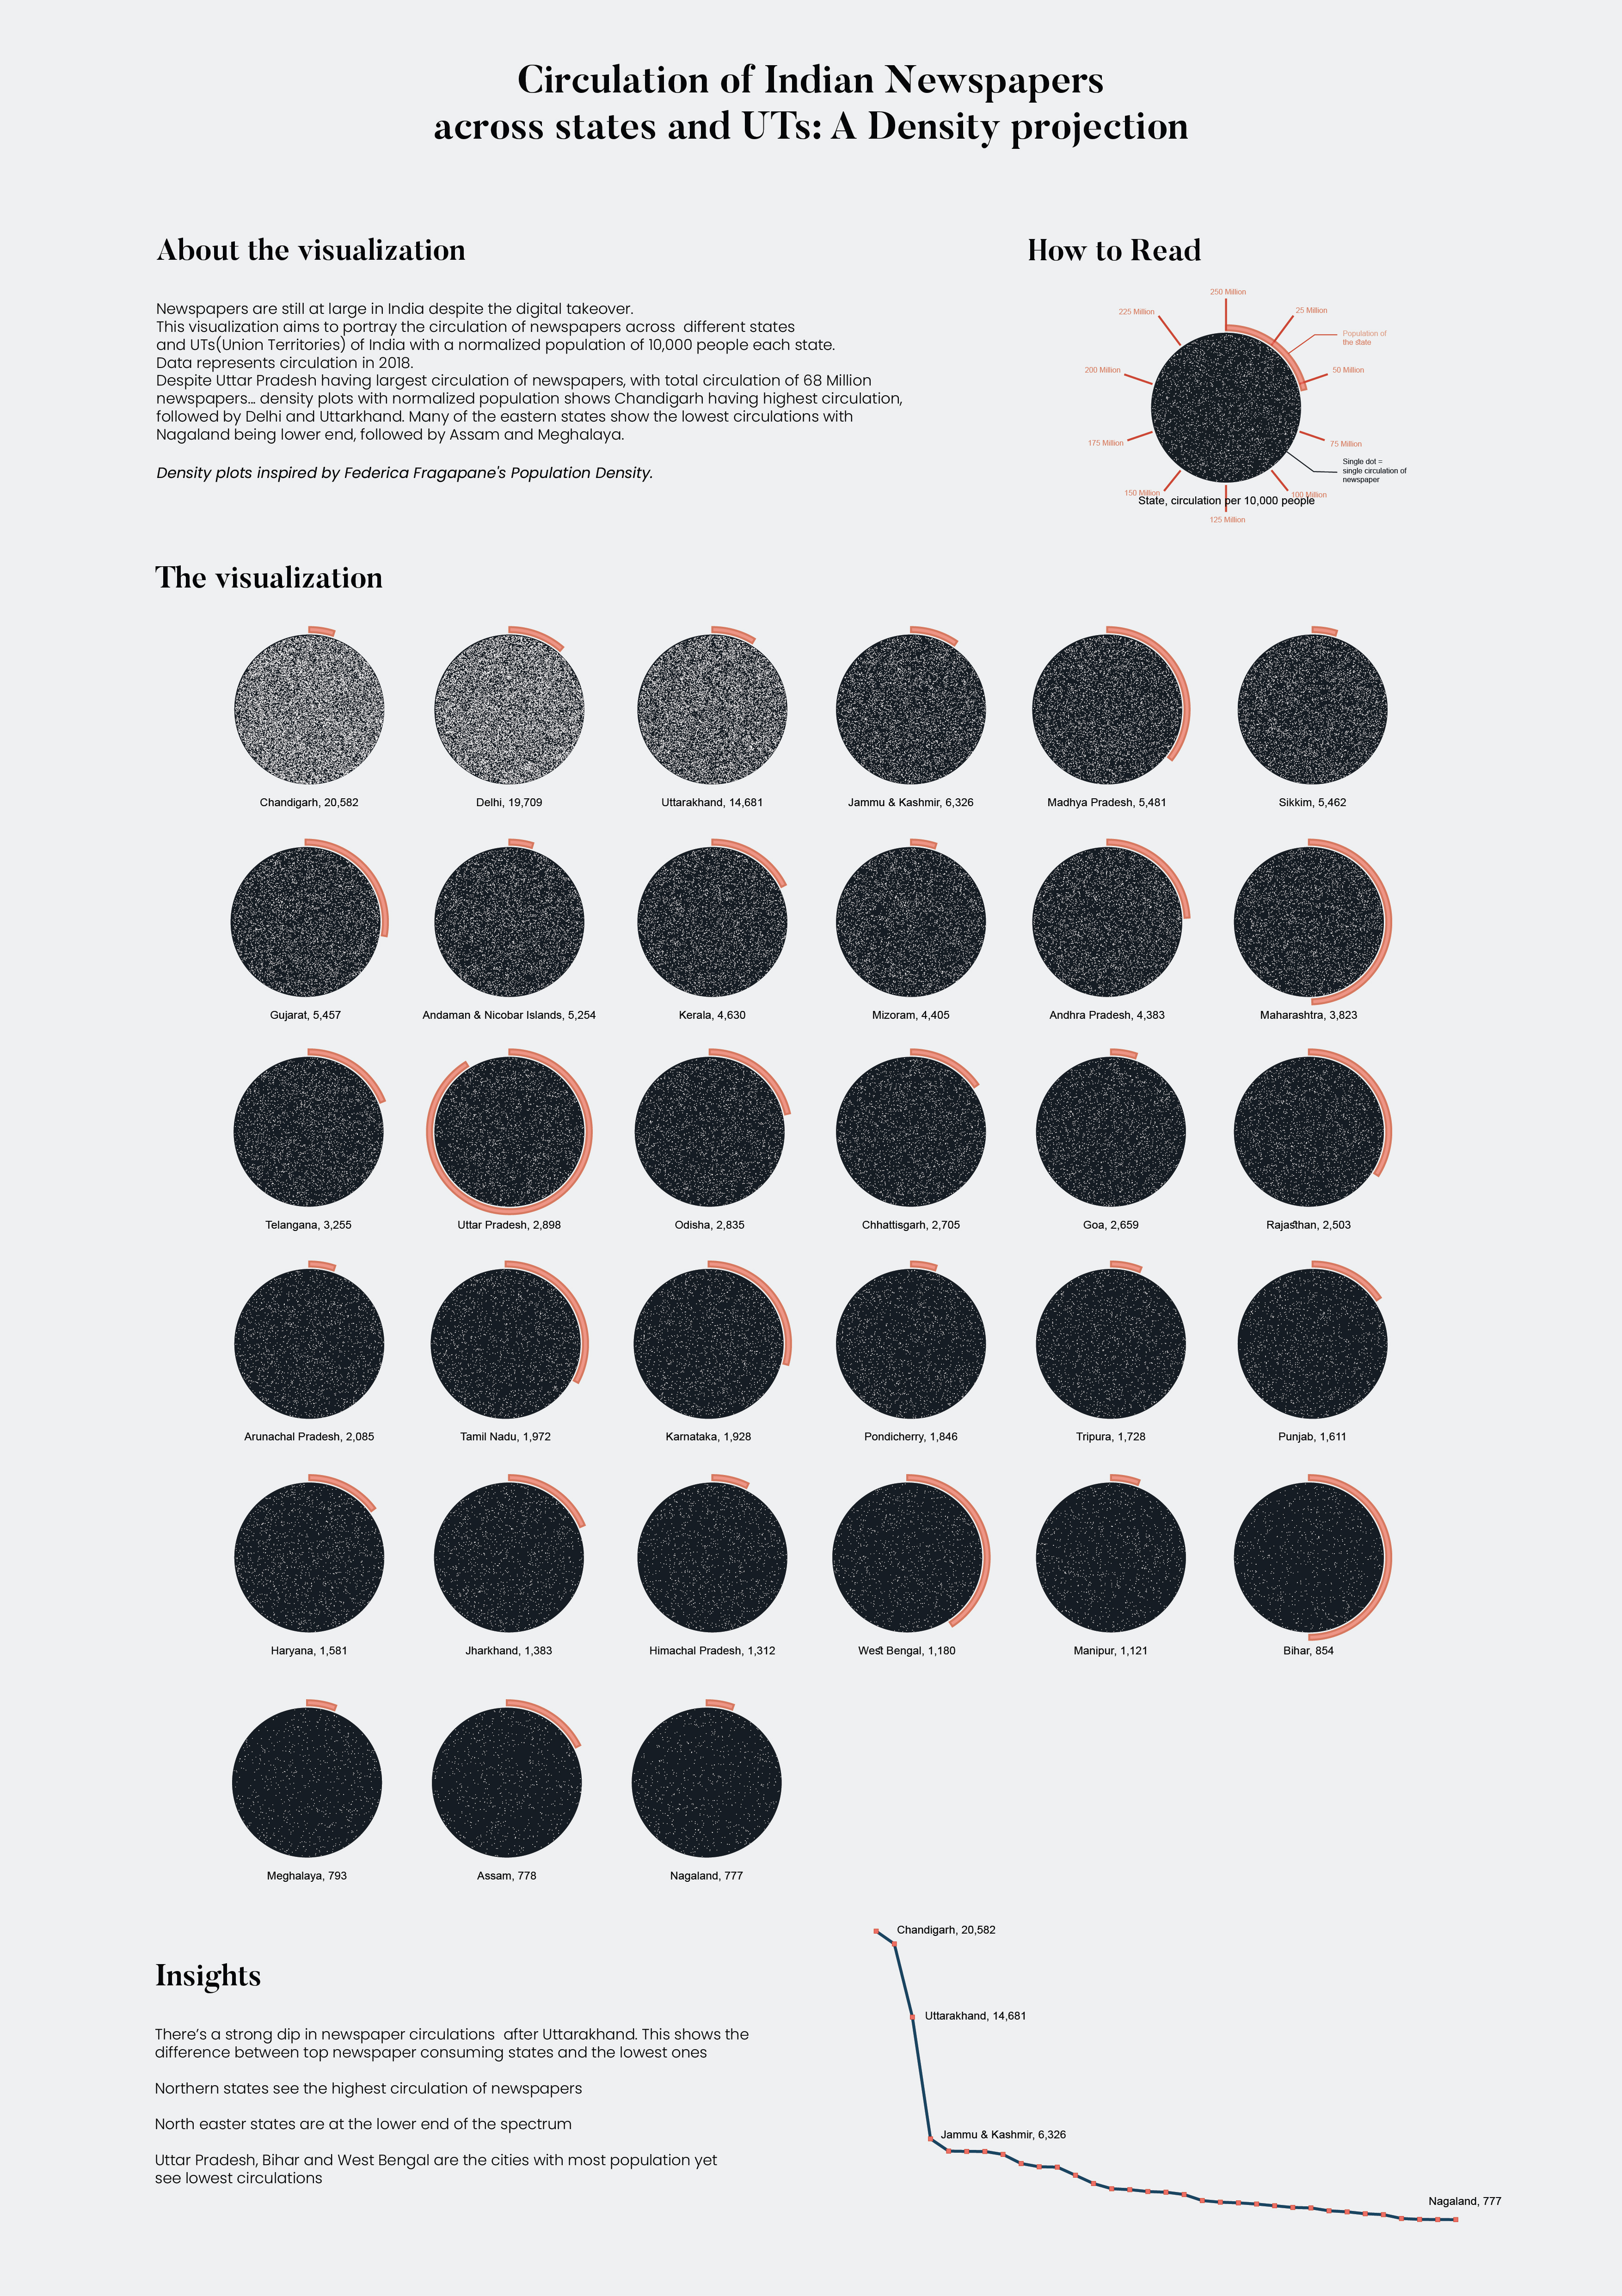
Newspapers are still at large in India despite the digital takeover. This visualization aims to portray the circulation of newspapers across different states and UTs(Union Territories) of India, with a normalized population of 10,000 people in each state. Data represent circulation in 2019.
Data was collected from a website: http://rni.nic.in/; I used Tabula to convert the downloadable PDFs to excel sheets for analysis and plot forming. Post this; I used D3.js to code the density charts for my visualization.
Some quick insights that followed:
Despite the fact that Uttar Pradesh has the largest circulation of newspapers, with a total circulation of 68 Million newspapers, density plots with normalized population show Chandigarh having the highest circulation, followed by Delhi and then Uttarakhand. Many of the eastern states show the lowest circulations, with Nagaland being the lower end, followed by Assam and Meghalaya.
The line graph section of the visualization also shows an unnatural dip in the circulation after the top three states
-
Credits
-
Award
-
Categories
-
See more


