Bowlers Bowling Spell in Cricket by University of Manchester
Description:
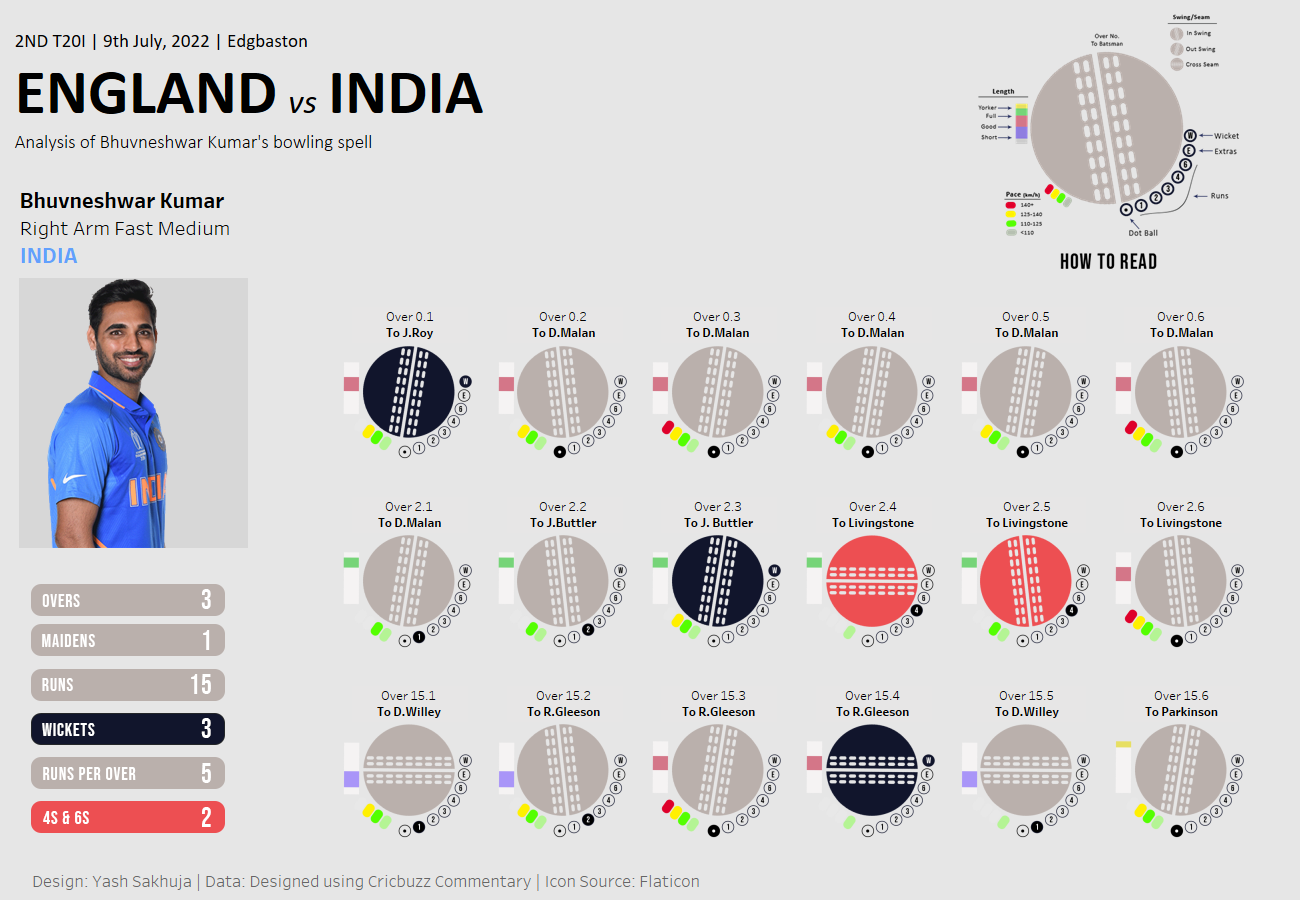
An innovative way to visualise and analyse the bowler's deliveries in terms of length, pace, swing/seam, and the result. It communicates the story of how the bowler planned his dismissals and set up the batters with changes in his bowling.
Tools & Methodology:
I utilised the map layers feature in Tableau to map the data in the form of layers using the shapes I drew on Figma.
The Story & Analysis:
In the 2nd T20 International between England and India, India's right-arm fast-medium bowler, Bhuvneshwar Kumar, bowled three overs (18 balls), conceding fifteen runs and picking three wickets.
Analysing Over 1 (0.1 to 0.6)
Swinging the new ball is his biggest strength as a bowler, so in the first over, he pitched all the deliveries in the good-length region at a good pace mixing up the inswingers and outswingers. He dismissed the English opening batter in the first ball of the innings and did not concede a single run in the first over. (over with no runs is termed a 'maiden' in cricket)
Analysing Over 3 (2.1 to 2.6)
In the second over of his spell, he tried to pitch the ball further up in the full-length region, changing the pace. Although one might say it proved to be a successful tactic as it got rid of the English captain, Jos Buttler, later in the over, he was also smashed for two consecutive boundaries. 11 of the total 15 runs he conceded came in that over.
Analysing Over 16 (15.1 to 15.6)
For the third and final over of his spell, when he came back to bowl towards the end of the innings to the tailenders, he bowled more cross-seam deliveries, not hunting for swing but deceiving the batters with slower balls and short-pitched deliveries. He deceived the lower-order batsman R.Gleeson by bowling a quick 140+ km/hr inswinging full-length delivery followed by a slow (less than 110km/hr) cross-seam ball, thereby tricking him into lofting the ball to a waiting fielder.
Usage:
1) Cricket analysts and coaches could use this visualisation type to make predictions based on the observed patterns that the bowler deploys to fox the batters. The bowlers also might utilise it the other way around to create and map strategies against the batters.
2) Broadcasters could use it to provide insights to the viewers by showcasing the bowling spells.
How to Create:
Follow this detailed guest blog of mine on how to create this visualisation in Tableau.
https://vizartpandey.com/how-to-create-shape-layers-in-tableau/
-
Credits
-
Award
-
Categories
-
See more


