Lumos Maxima by Kirti Vardhan Rathore, Rasagya Sharma
It all began with a simple question, “Am I a reader or just another hoarder?”.
During the lockdown when all my belongings came to my house, I realized the number of books I owned. So, I decided to see how many of them I have read and how many remain untouched.
Once I was done cataloging them in Excel, it took me just seconds to realize that about 50% of them are unread. Then began the quest for finding new questions that I would like my data set to answer and how the visualization can help me read the unread books.
The first attempt was to just make a bar graph of books on the time axis. This helped me in understanding my buying habits. But still, the reason for reading and nudging to read more was missing.
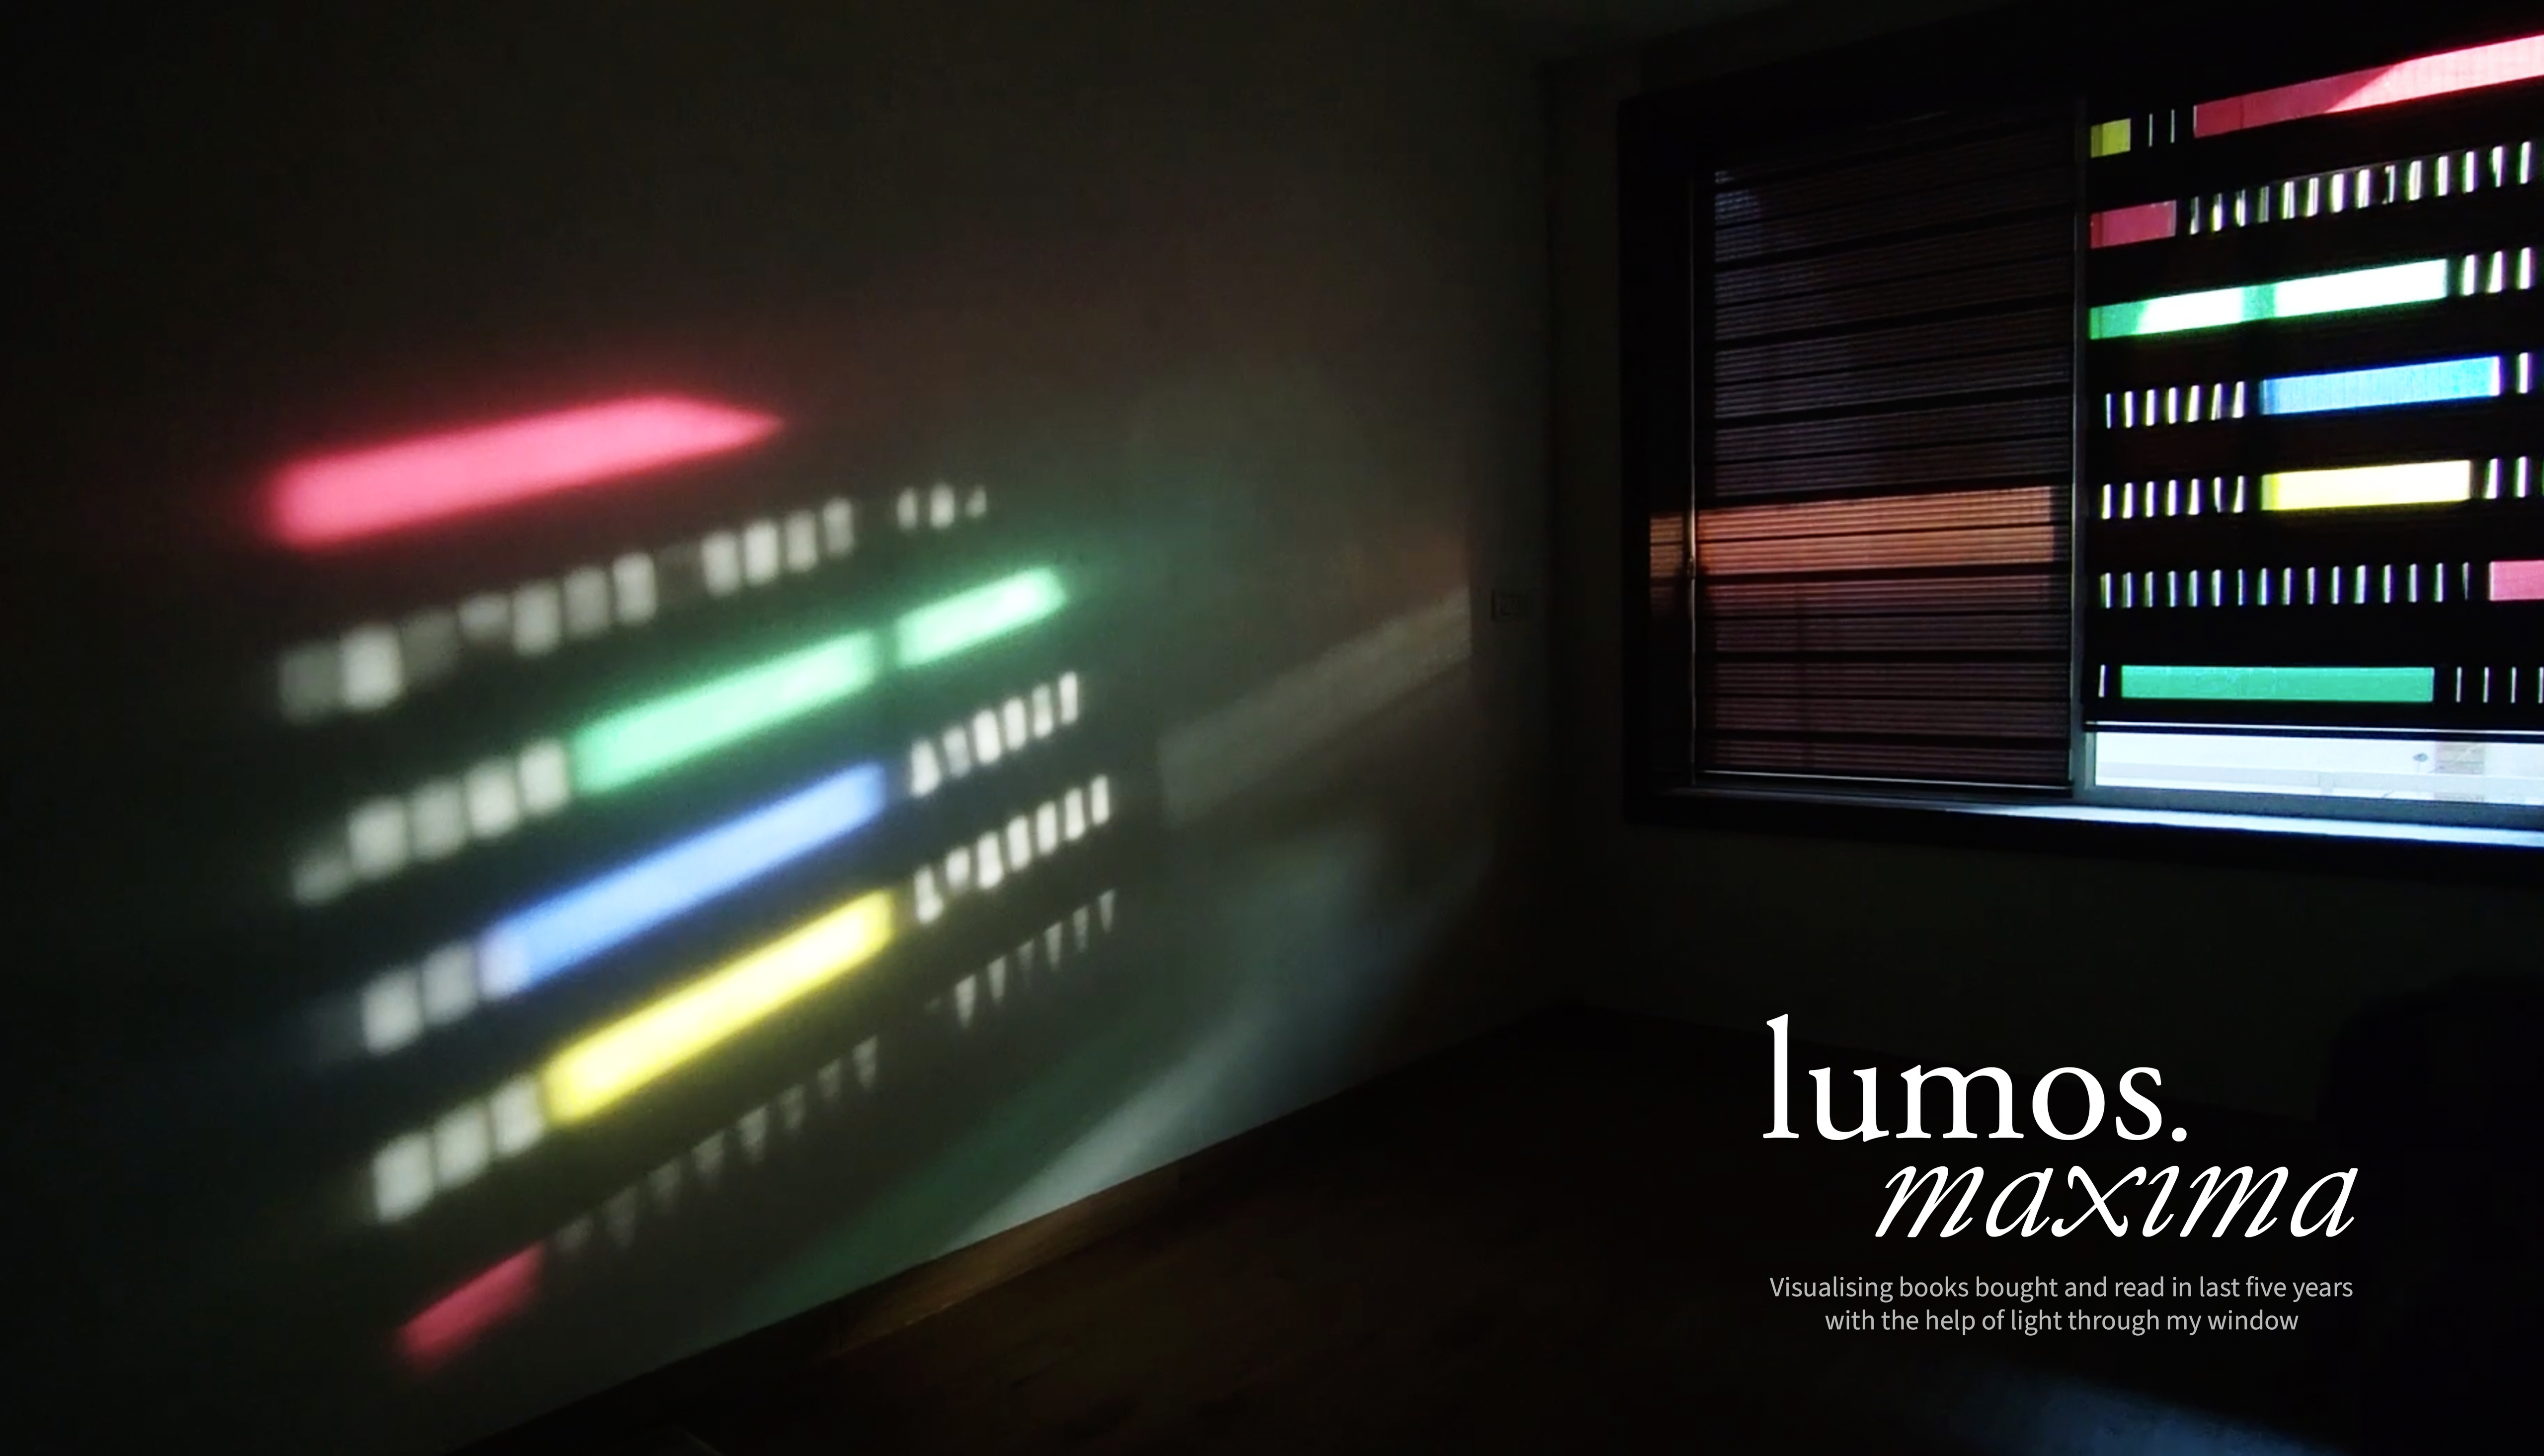
Next came the idea of using ‘light’ to denote ‘enlightenment’ and ‘moving shadows’ to show the gradual passage of time.
I used the huge east-facing window of my study, put out cellophane paper for books that I have read, and blocked the rest of the places with black paper so that light cannot pass, demoting the lack of knowledge.
In simple terms, a continuous stacked bar chart was getting projected on the wall using sunlight. A change in color of cellophane paper denoted the change of the year.
As the sun keeps on rising the shadows will slowly move out and disappear, a constant reminder to get enlightenment before it is too late.
Did this make me read more? I will let time answer that question. And maybe it’s not about reading, it’s about the possibility of reading.
-
CreditsGuided By: Rasagya Sharma
-
Award
-
Categories
-
See more


