Covid-19 graphics for frontline doctors in 2020 by Will Stahl-Timmins
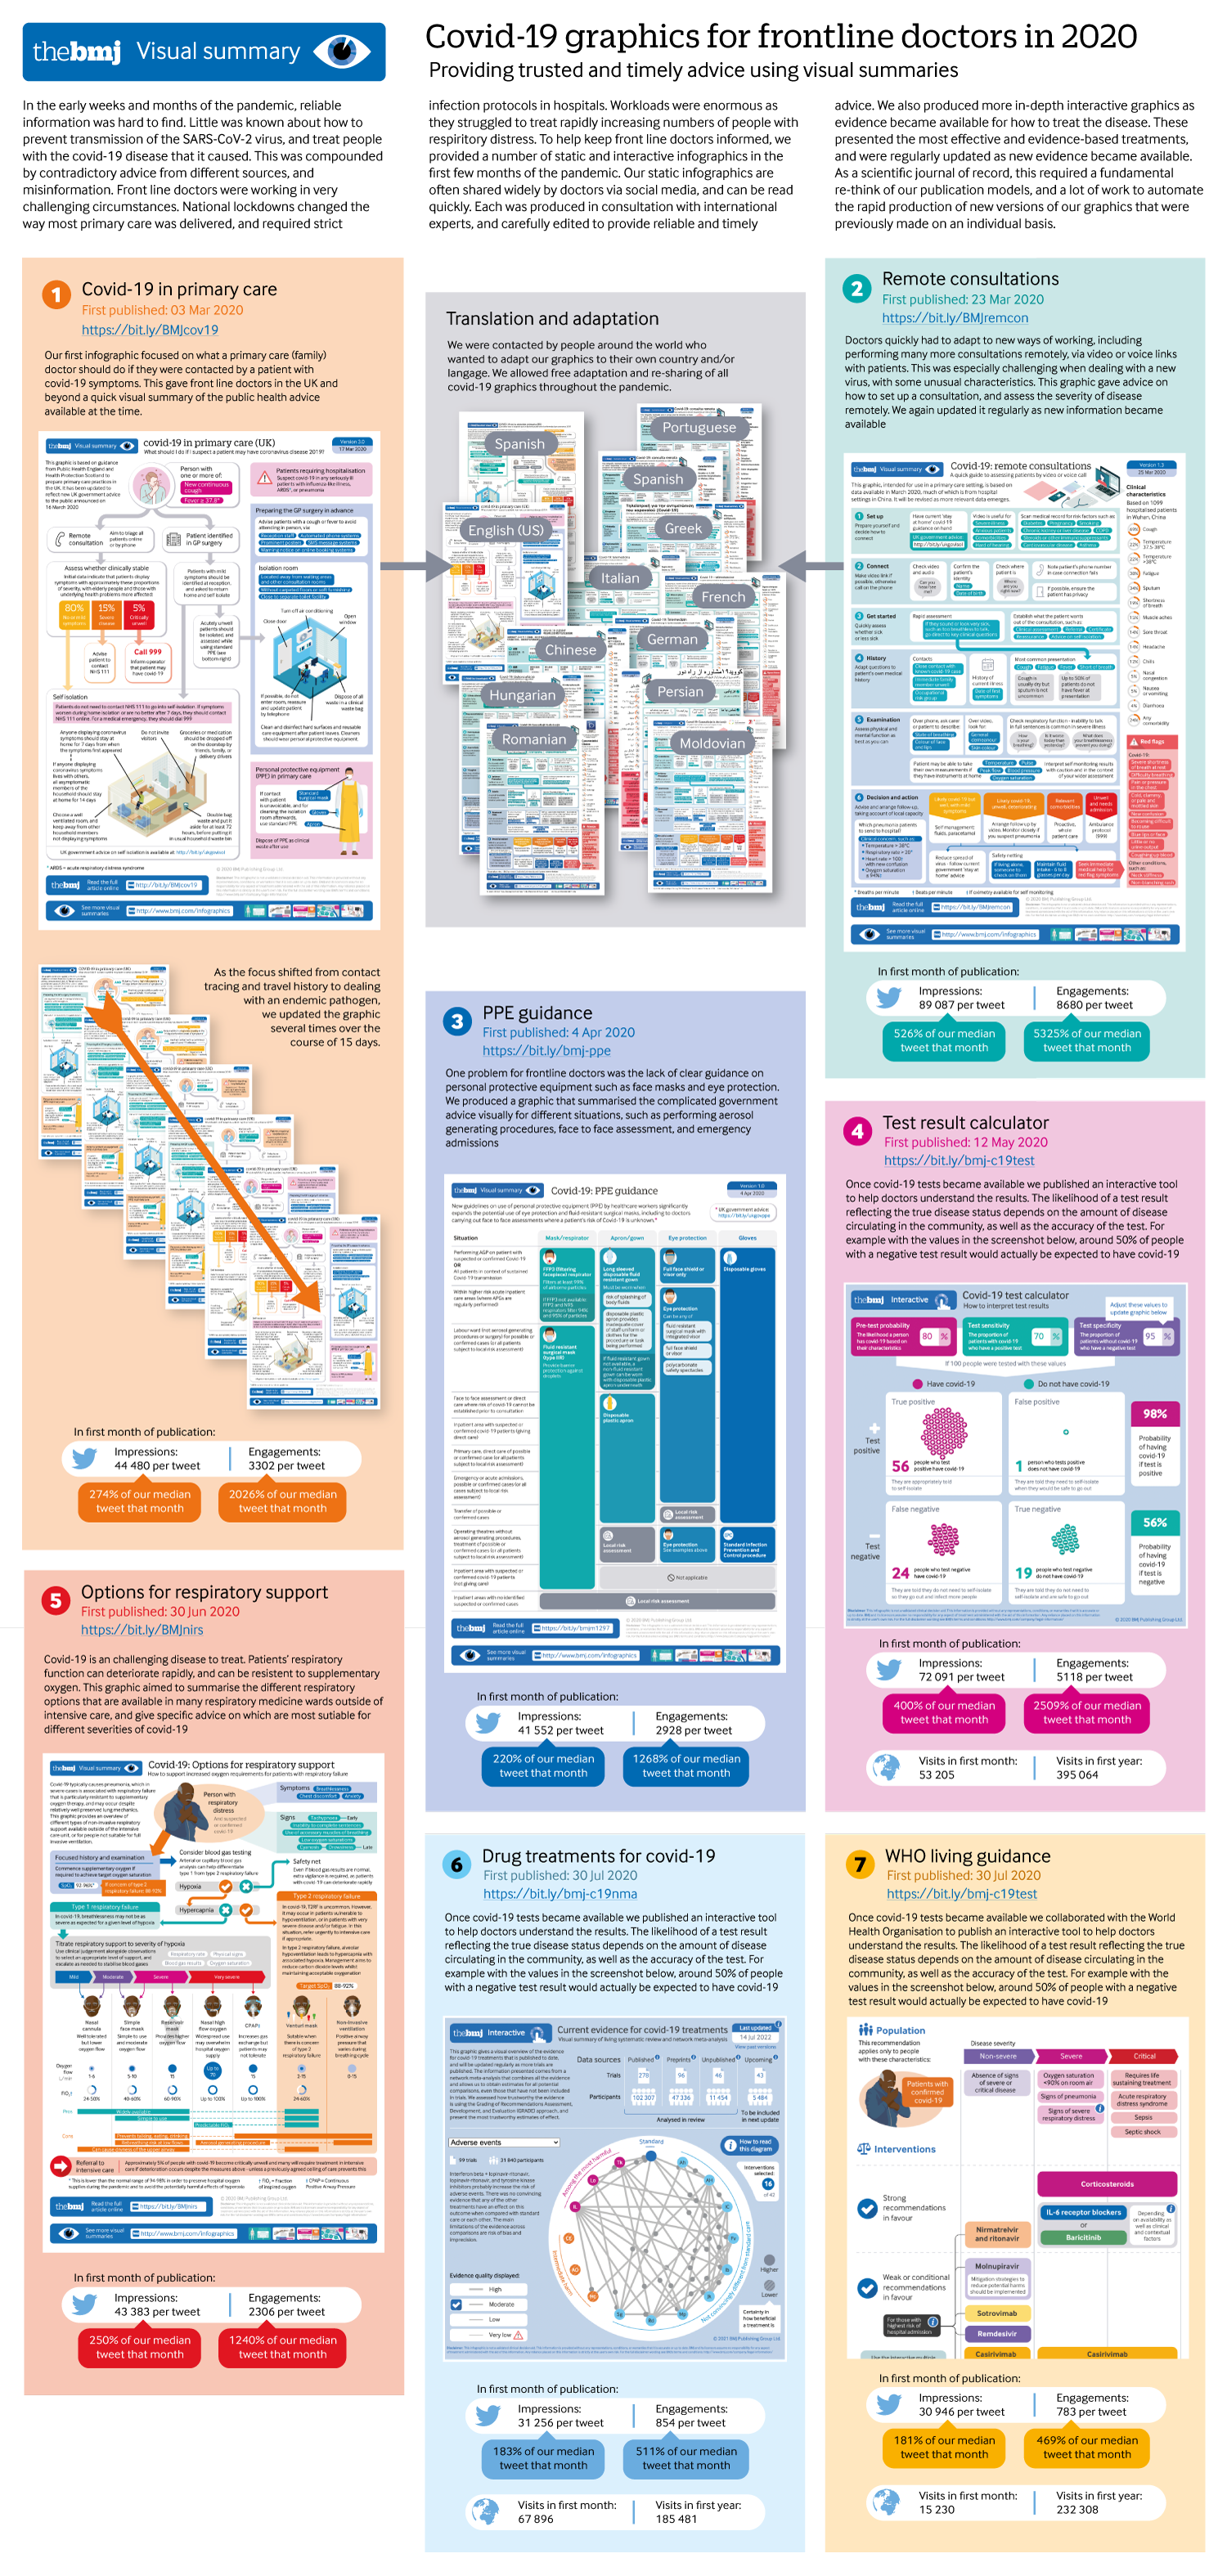
In the early weeks and months of the pandemic, reliable information was hard to find. Little was known about how to prevent transmission of the SARS-CoV-2 virus, or treat people with the covid-19 disease that it caused. The traditional networks of transmission of scientific information (scientific publication in journals/conferences/etc) gave way to more informal networks of communication of ideas through social media, and closed whatsapp groups. We needed to create uptodate information that could flow easily through those networks, and maintain its integrity - and infographics became the way in which we did that. Each was produced in consultation with international experts, and carefully edited to provide reliable and timely advice. We also produced more in-depth interactive graphics as evidence became available for how to treat the disease. As a scientific journal of record, this required a fundamental re-think of our publication models, and a lot of work to automate the rapid production of new versions of our graphics that were previously made on an individual basis. In total, they received over 1.1 million impressions and 75,000 engagements on Twitter, in their respective months of publication
-
Credits
-
Award
-
Categories
-
See more


