Interactive Periodic Table Of Oil by Martina Klancisar, Eklavya Gupte, Andy Critchlow, Reynaldo Dizon
Platts removes an element of confusion in the oil markets...
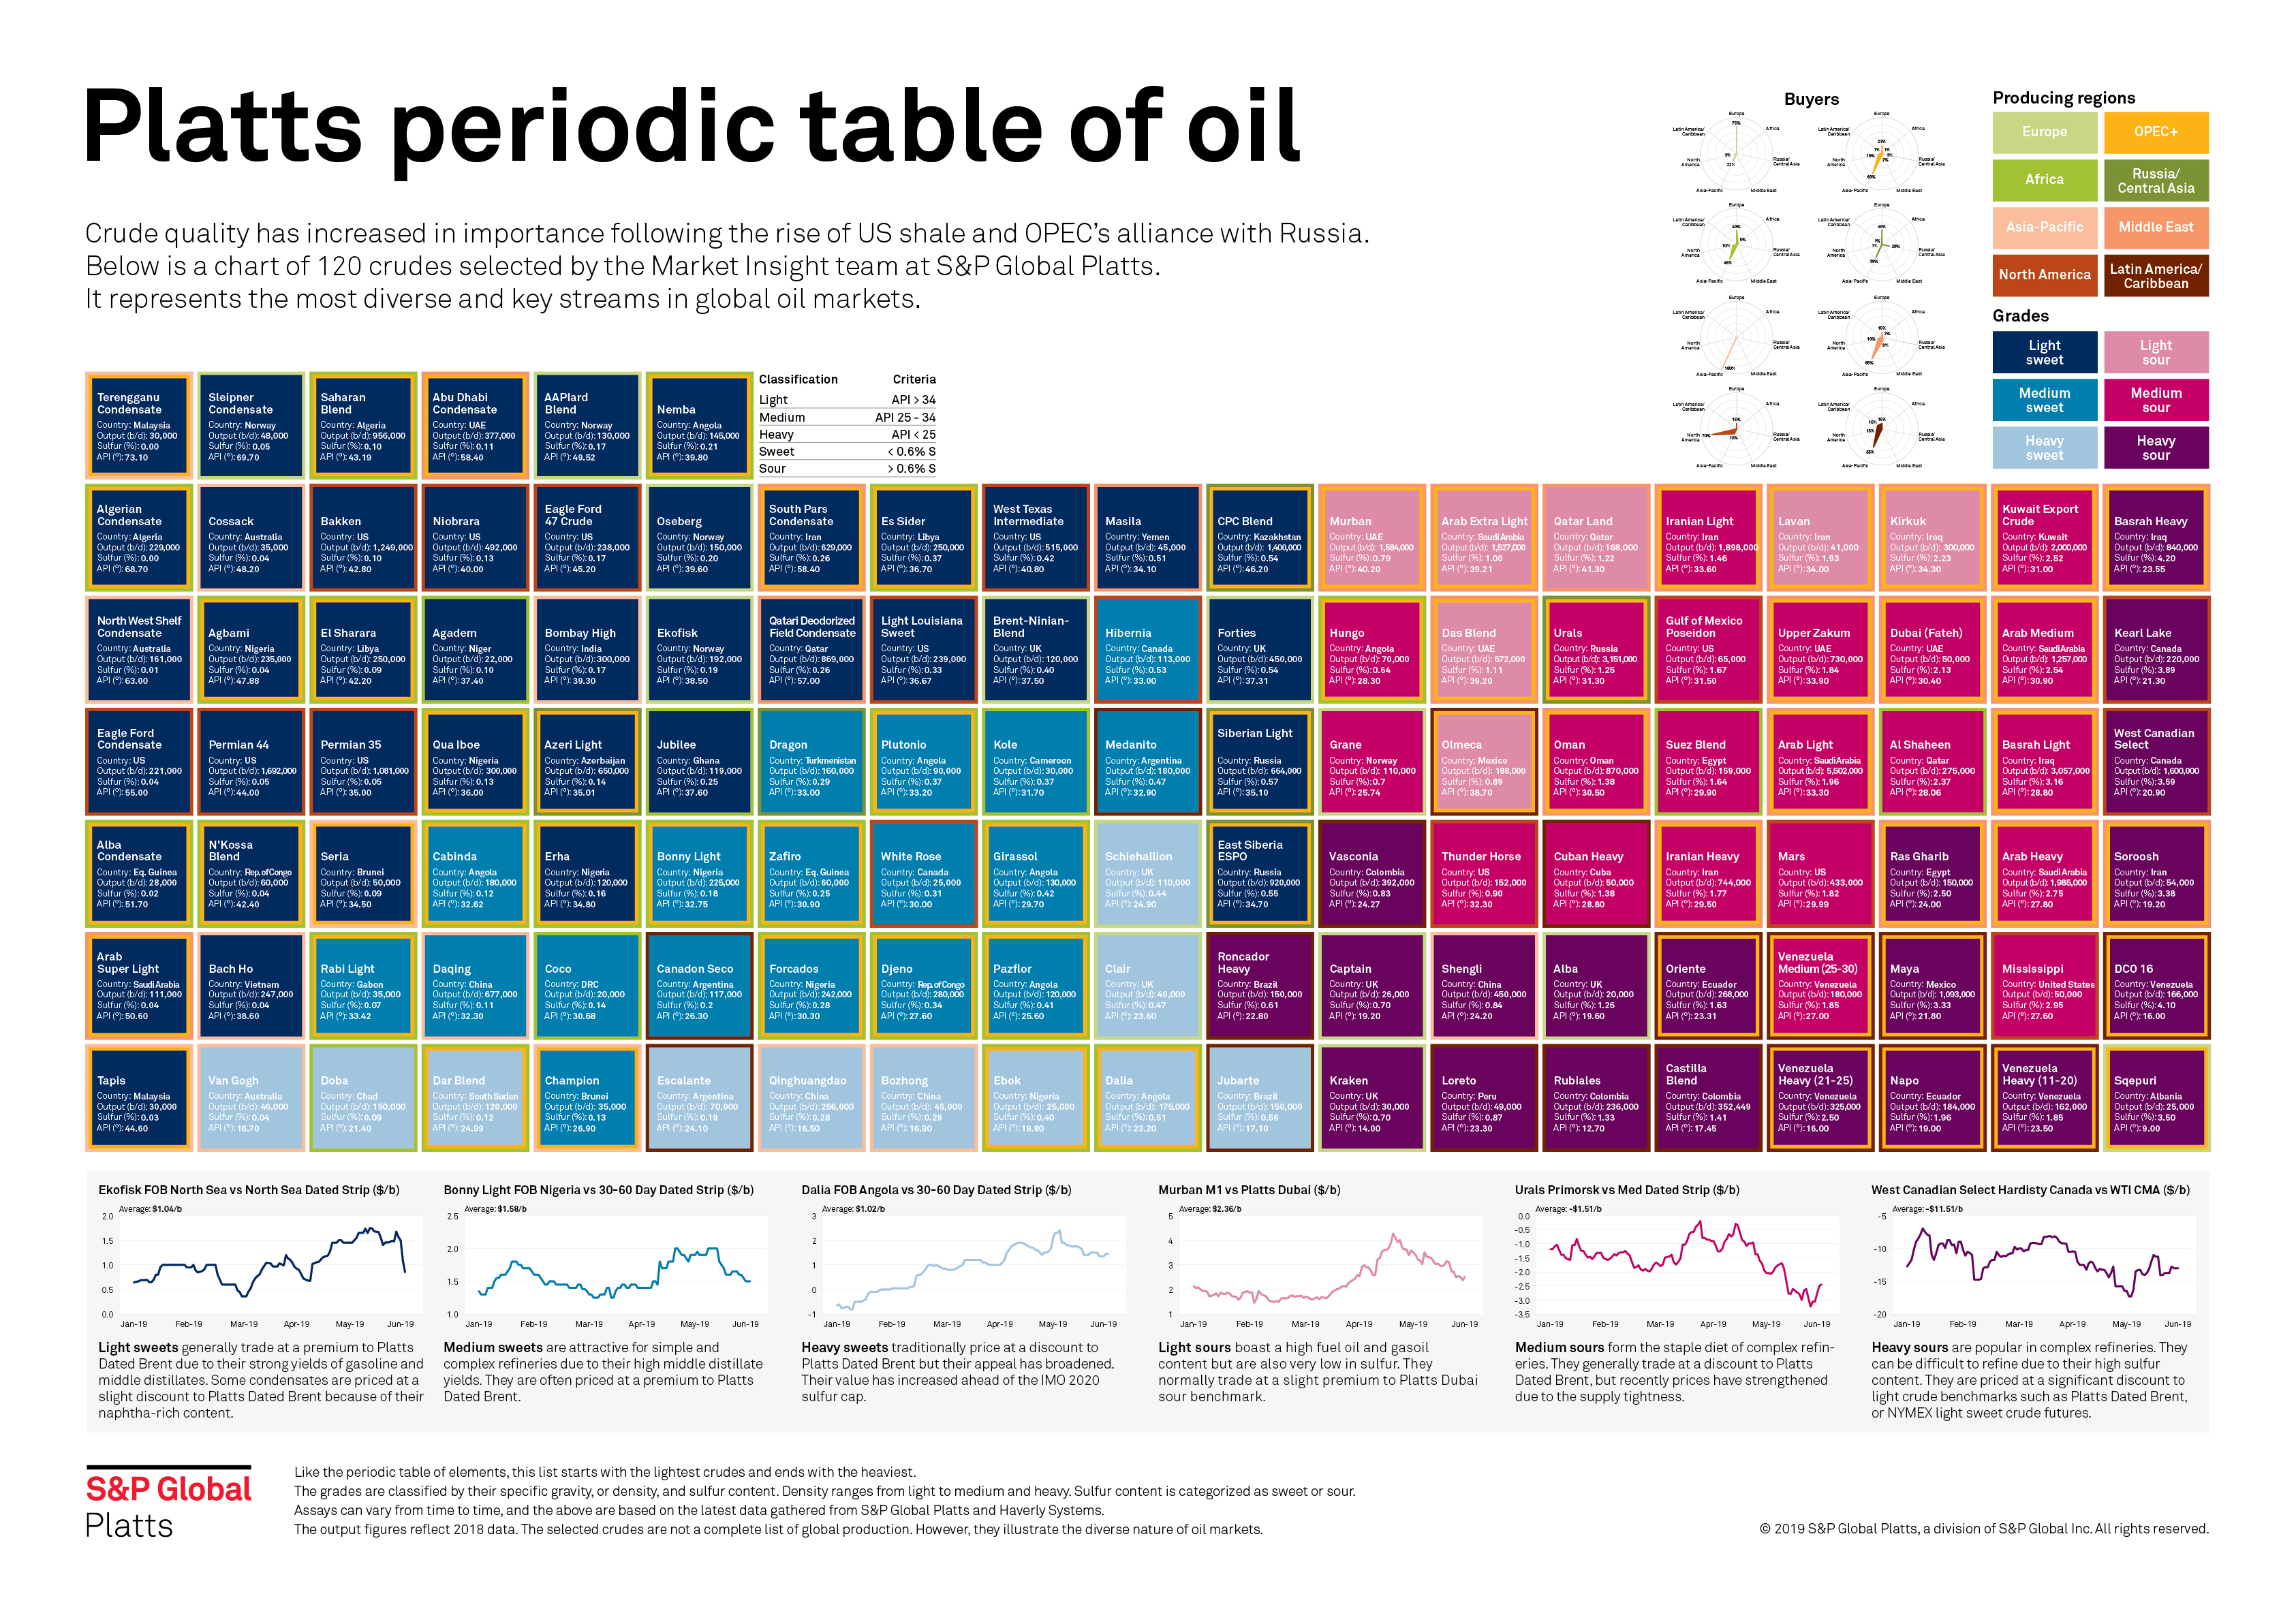
S&P Global Platts has created the first ever interactive Periodic Table of Oil. It unravels the complexity of the $1.7 trillion oil market that has bamboozled energy journalists, traders and governments. Until now.
With hundreds of different grades making up the world’s daily 100 million barrel diet of crude, traders need to know vital information about each barrel’s density, sulfur content and production levels, as well as where it’s produced and who buys it.
Using the Periodic Table as inspiration, Platts found an innovative way to order this information. Like the Table of Elements, which is celebrating its 150th anniversary this year, the crudes are ordered from lightest to heaviest.
The graphic also allows users to see which crude oil grades are traded in specific regions in addition to their relevant price benchmarks. It shows, for example, how OPEC, through its alliance with Russia, may have lost market share but gained control of the key grades wanted by refiners.
It allows readers to slice and dice the information depending on their market's needs.
But don’t just take our word for it. Oil market participants are raving about it. A director at Clearview Energy Partners said the table “deserves a Nobel prize for the visual presentation of quantitative data.”
While a director of Petromatrix daily research note tweeted: “Very cool. This is a must bookmark.”
The entrant has supplied an additional file for this project: [1]
-
CreditsMartina Klancisar, Team Lead, Design & Production; Eklavya Gupte, Senior Editor, Petroleum News; Andy Critchlow, Head of News, EMEA; Reynaldo Dizon, Design & Production Associate
-
Award
-
Categories
-
See more


