Resettlement, Relief And Return by Jessica Gergen
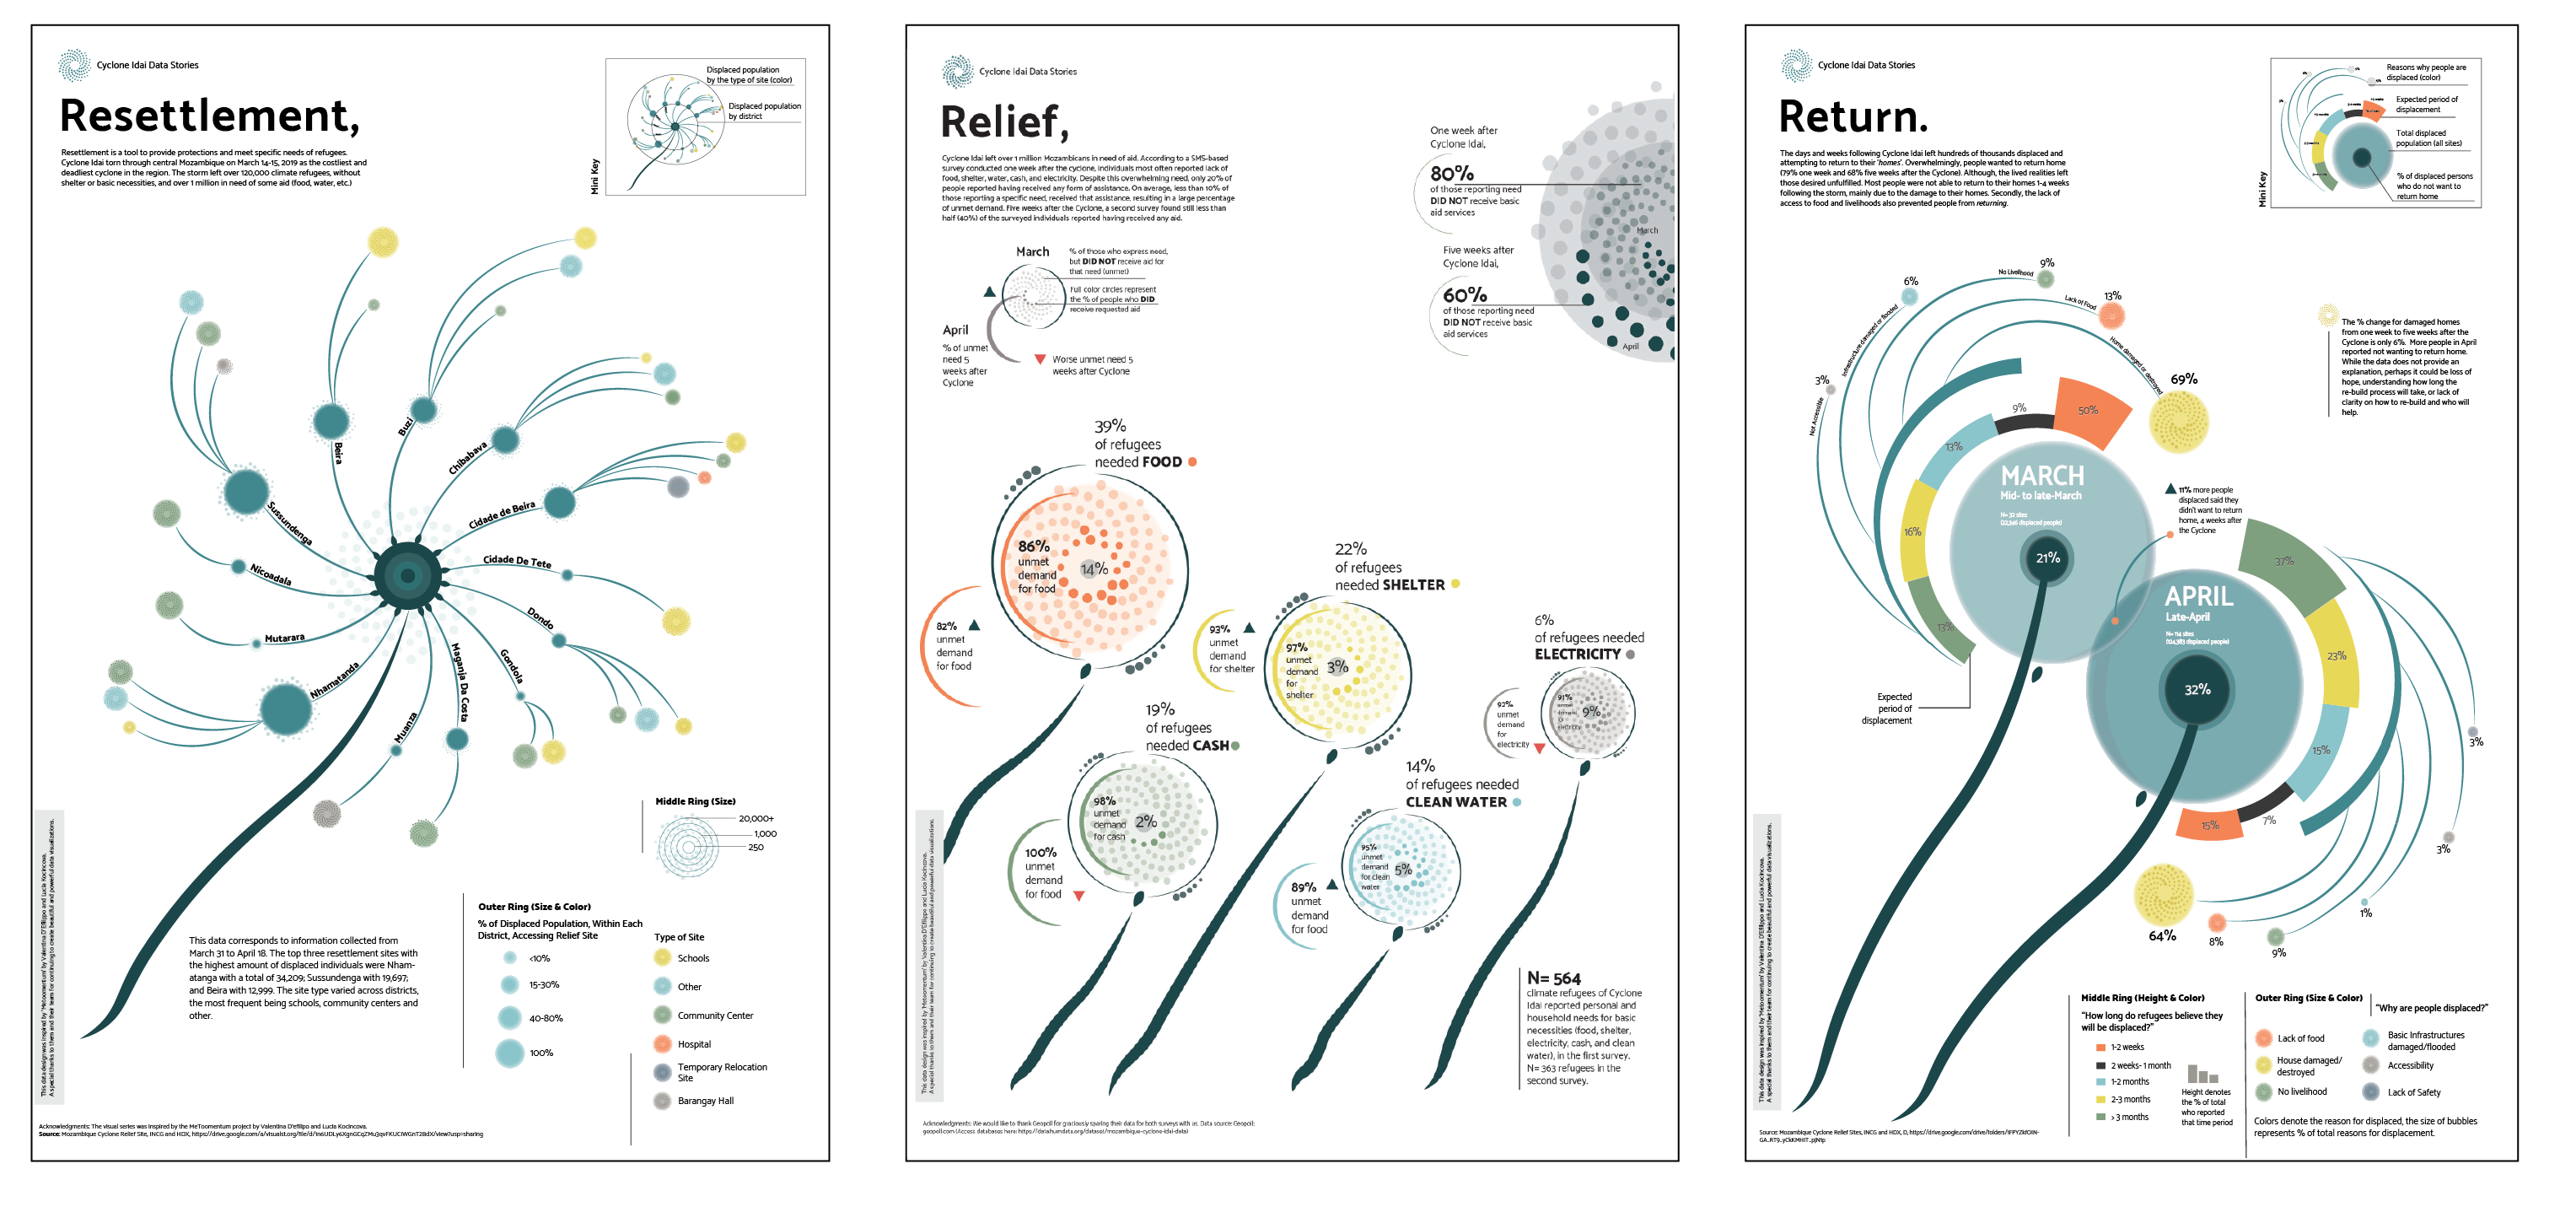
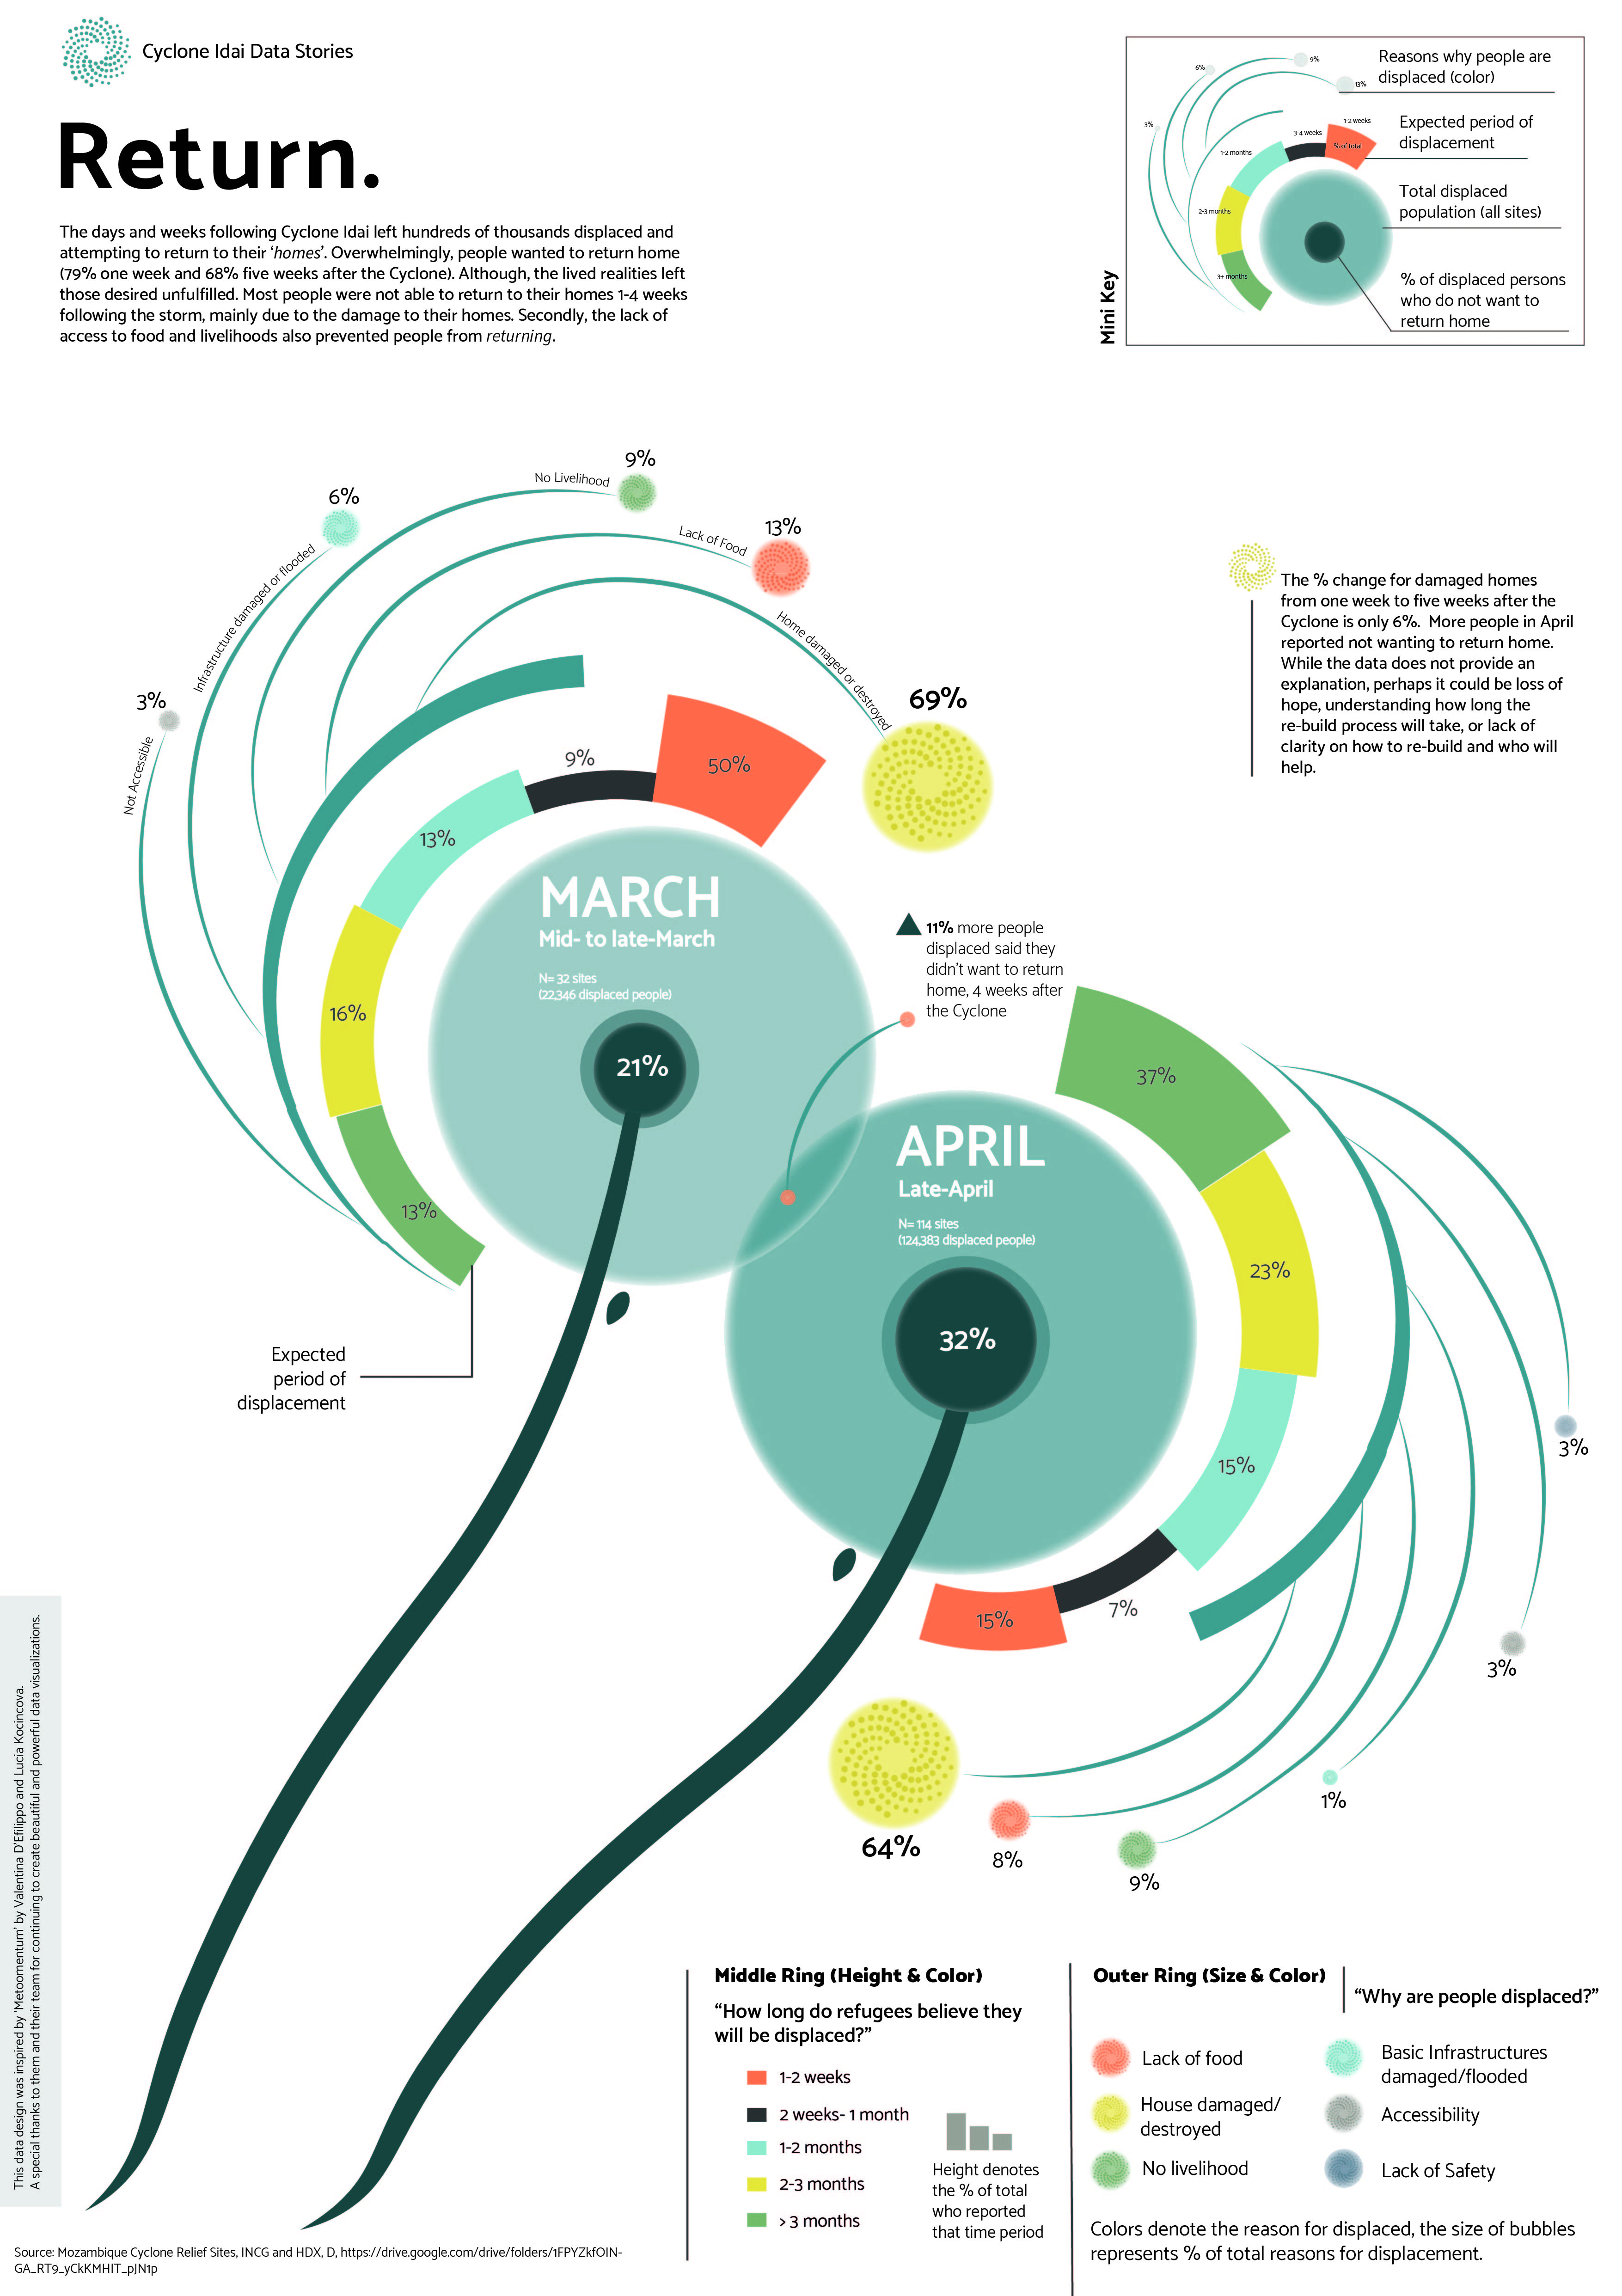
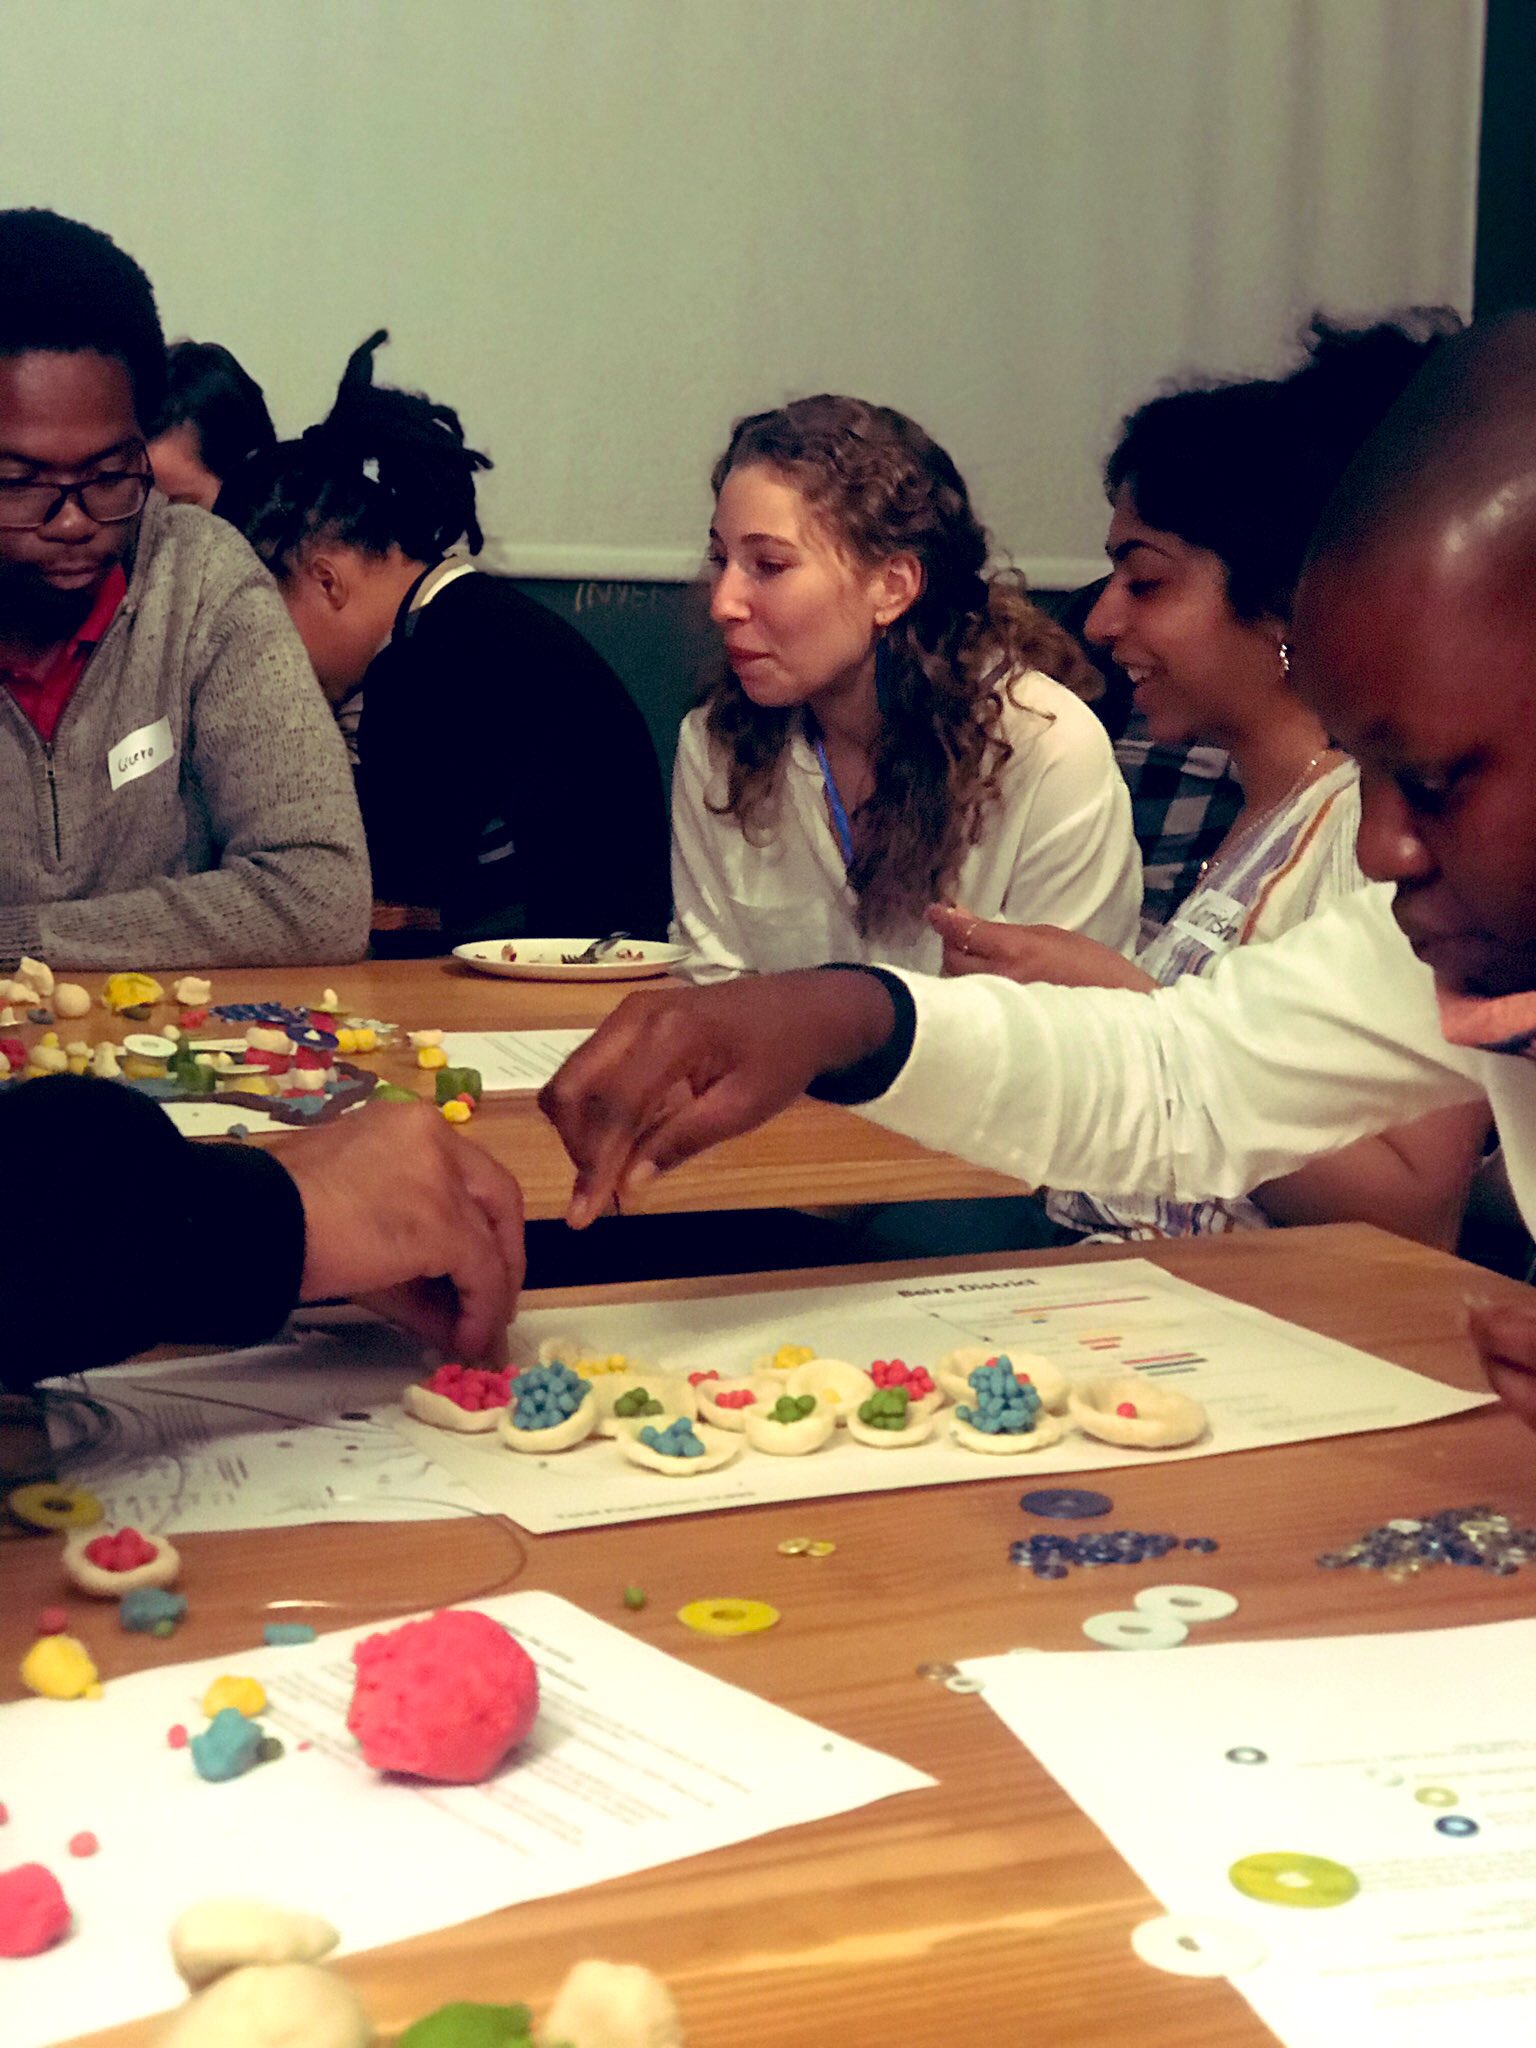
This poster series of data stories on the Cyclone Idai humanitarian response was a component of a Data-Art workshop to create data sculptures. To produce these posters, we collected open source data from the Mozambican government, UN agency and the aid relief partners working in the Shelter, Food, and Water clusters. Our analysis is displayed in three phases, the first is resettlement, which communicates the distribution of displaced individuals, ‘Relief’ shows the reported need and how/where resources were allocated, and ‘Return’ captures the change in perception and expectation of displacement. Our team presented the posters first to explain what data we would be using to create the data sculptures. Then small groups made up of architects, data analysts, and creatives alike crowded around their assigned district map, labeled with community populations, 'expected displacement time', and the top three most urgent needs. They were first tasked to build a 'needs' map from the lens of relief workers. Once they created their map, it was time to develop their strategy for relief according to the data that recorded needs of survivors and displaced households.
The entrant has supplied multiple files for this project:
[1] [2] [3] [4] [5] [6]
-
CreditsJessica Gergen; Giselle Heintz (Storyteller); Mariana Surillo (Advocate); Mary Chandler (Analyst)
-
Award
-
Categories
-
See more


