Visualizing Every Assessment by Darkhorse Analytics
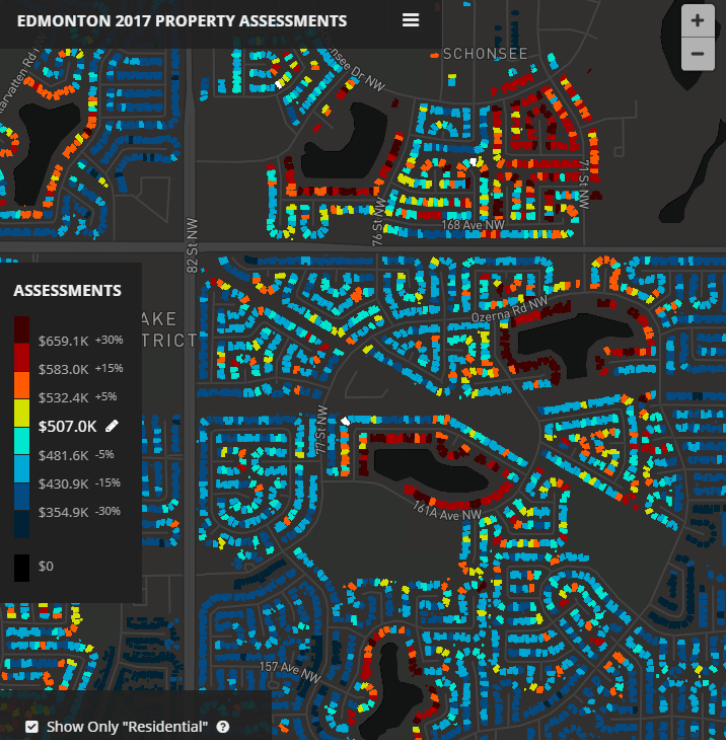
What if you could visually compare any property's assessment value against all others in a city with a click? What interesting patterns could you find?
Starting with those questions, the project evolved from a technical conundrum (how do you color 300,000 buildings dynamically?) into a storytelling and exploratory tool. Dive in yourself, or let the tool guide you through highlighted stories within and between different cities, currently with Vancouver, San Francisco, and Edmonton.
-
CreditsDarkhorse Analytics
-
Award
-
Categories
-
See more


