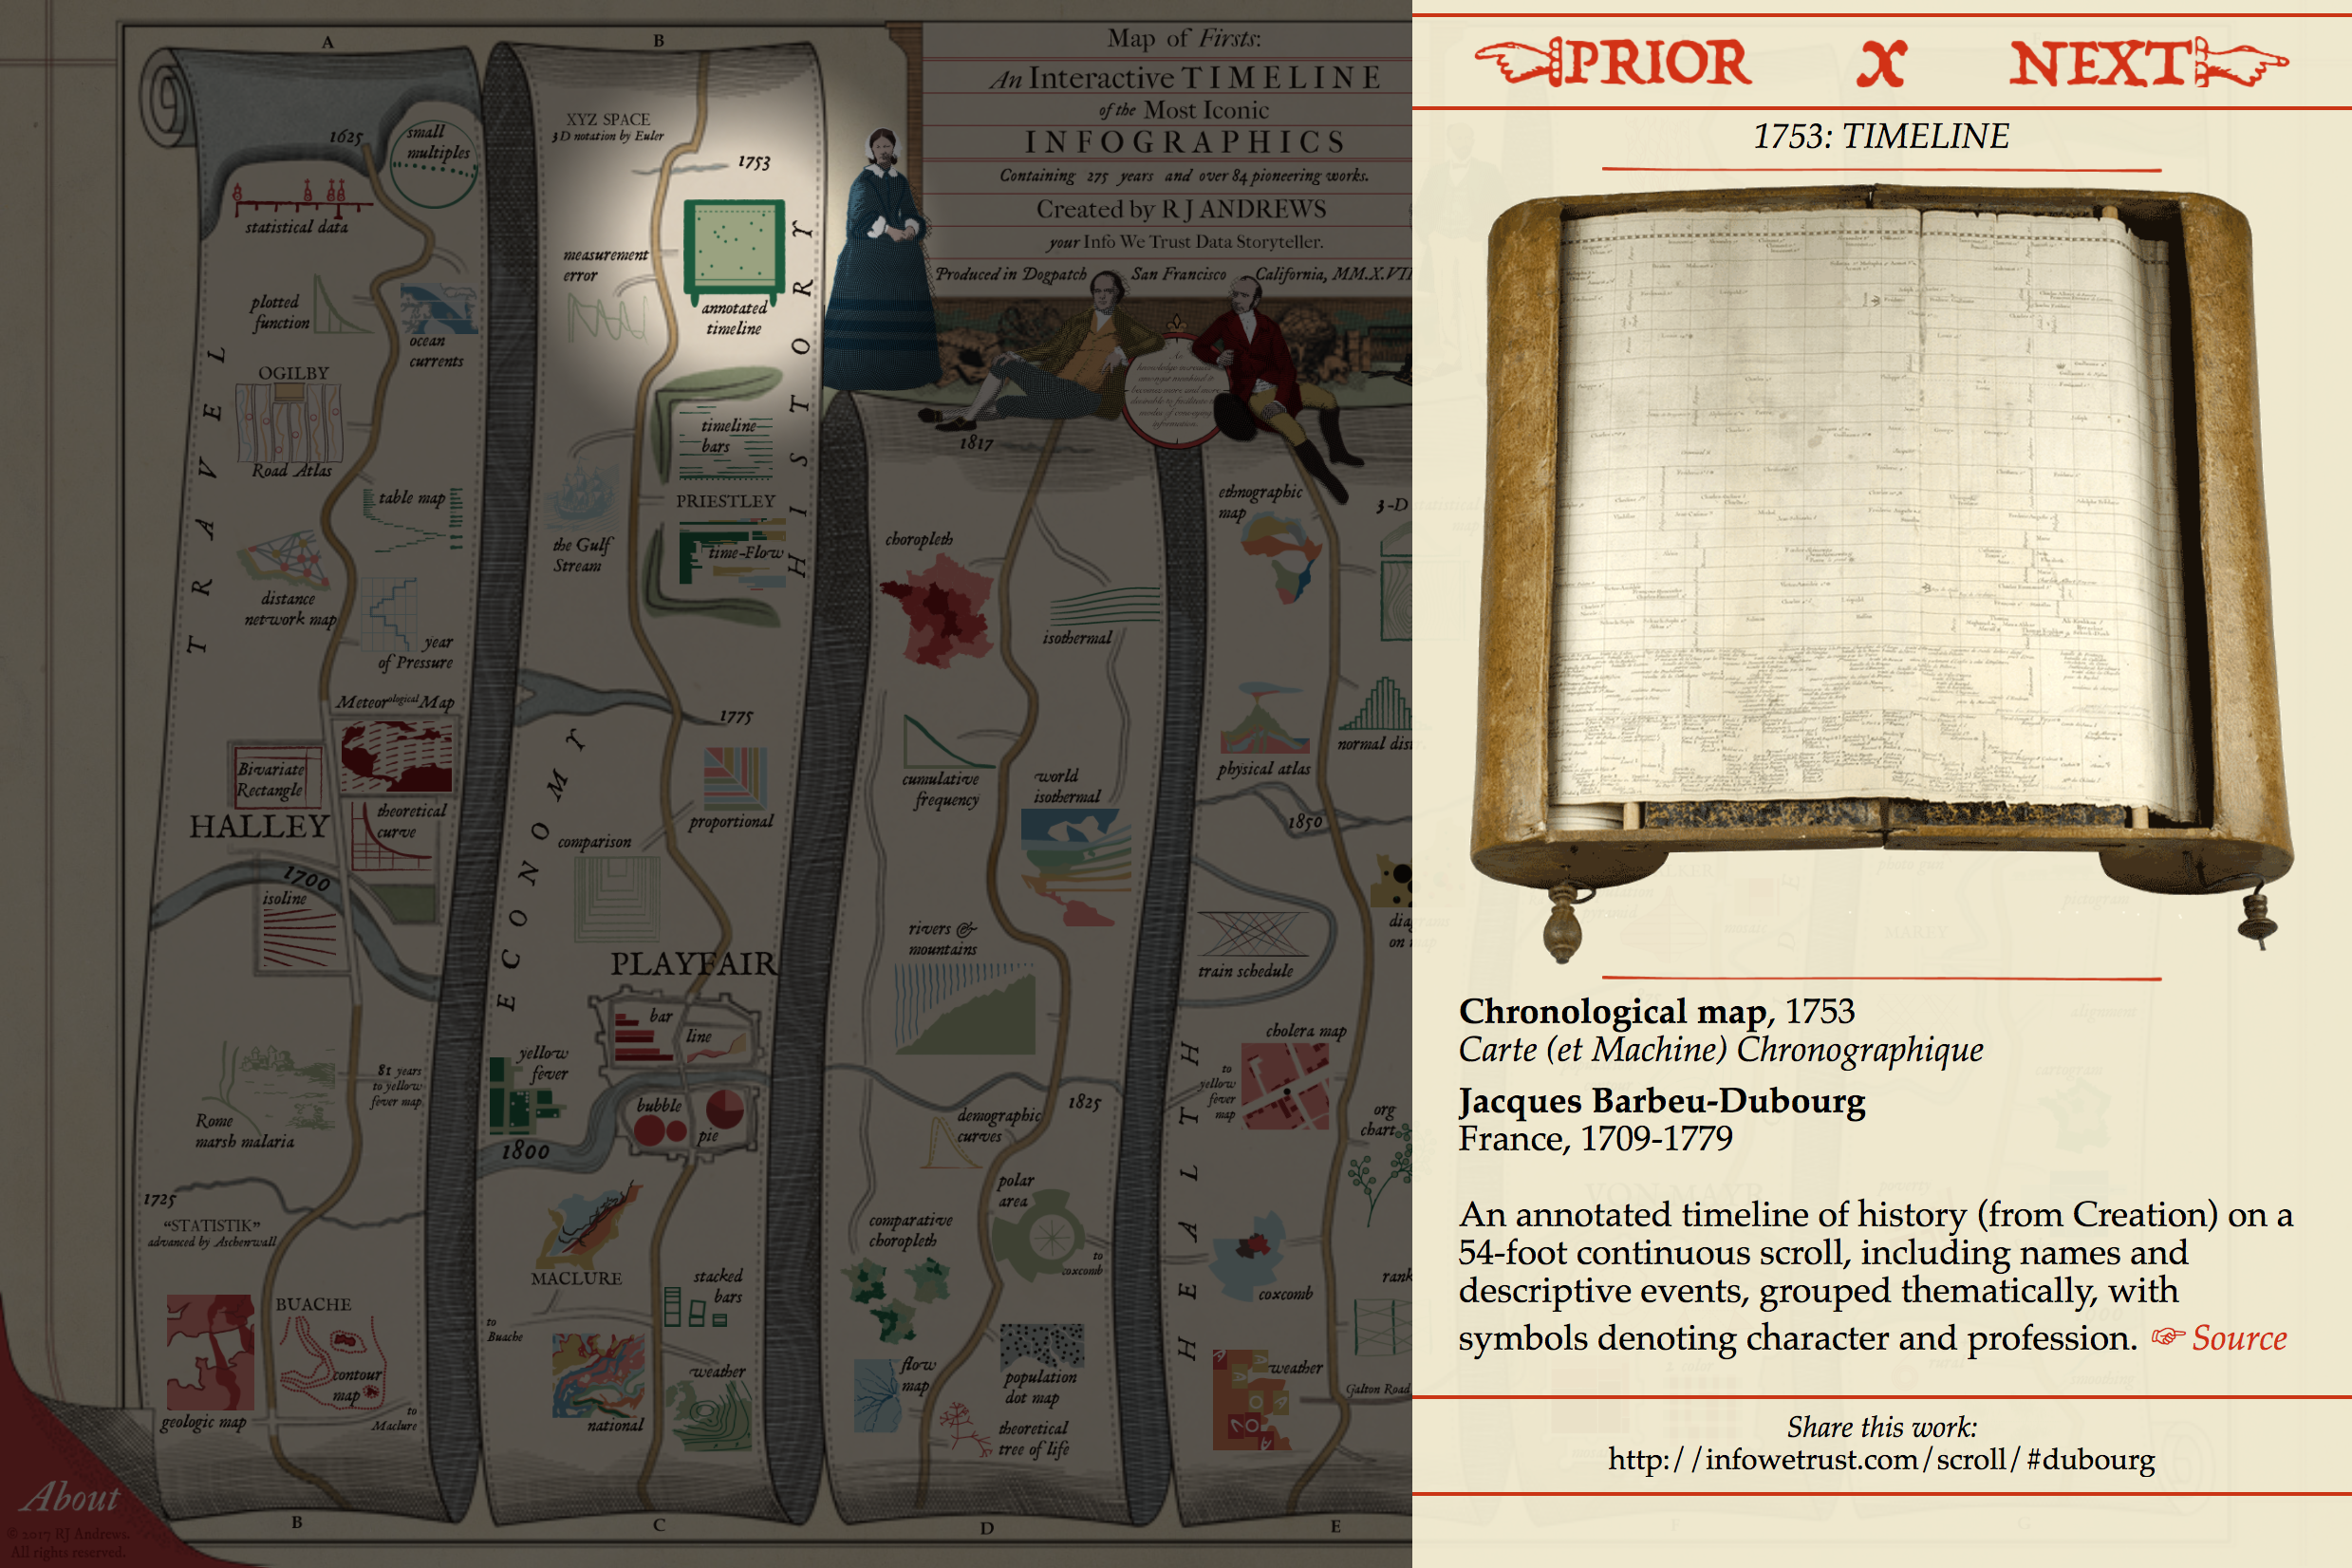
Map of Firsts by RJ Andrews
A dynamic roadmap through the early developments of data visualization, in the style of John Ogilby’s 1675 Atlas.
Original illustrations and interactive design guide you through time past cartoons representing 86 milestones of our field. Towns are named for key contributors and waterways mark important dates. Selecting any cartoon opens an overlay where you can see and learn more about the original.
Loaded with references and packed with Easter eggs, this one is best enjoyed on a big screen.
The creator of this work has supplied multiple images, please click here to view.
-
CreditsRJ Andrews
-
Award
-
Categories
-
See more


