
The healthcare industry has seen an alarming rise in data breaches.
2023 has been considered the worst year so far in US healthcare with 160 million healthcare records exposed. The largest...
-
 View projectWhat’s driving up burger prices? looked at Australia’s inflation figures through the lens of an everyday item. The Big Mac is both visually iconic and deeply interconnected with the broader...
 -
 View projectThis incredible project will immerse you in the wild world of the Chornobyl Zone. You can see and even hear the voices of animals and birds—from Przewalski's horses to the Ukrainian brook lamprey....
 -
 View project‘Renewable Rhythms’ is a dynamic data-painting installation created by the generative artist collective The “What If” Project, led by Daniele Giannini, an IT professional at Terna, the Italian...
 -
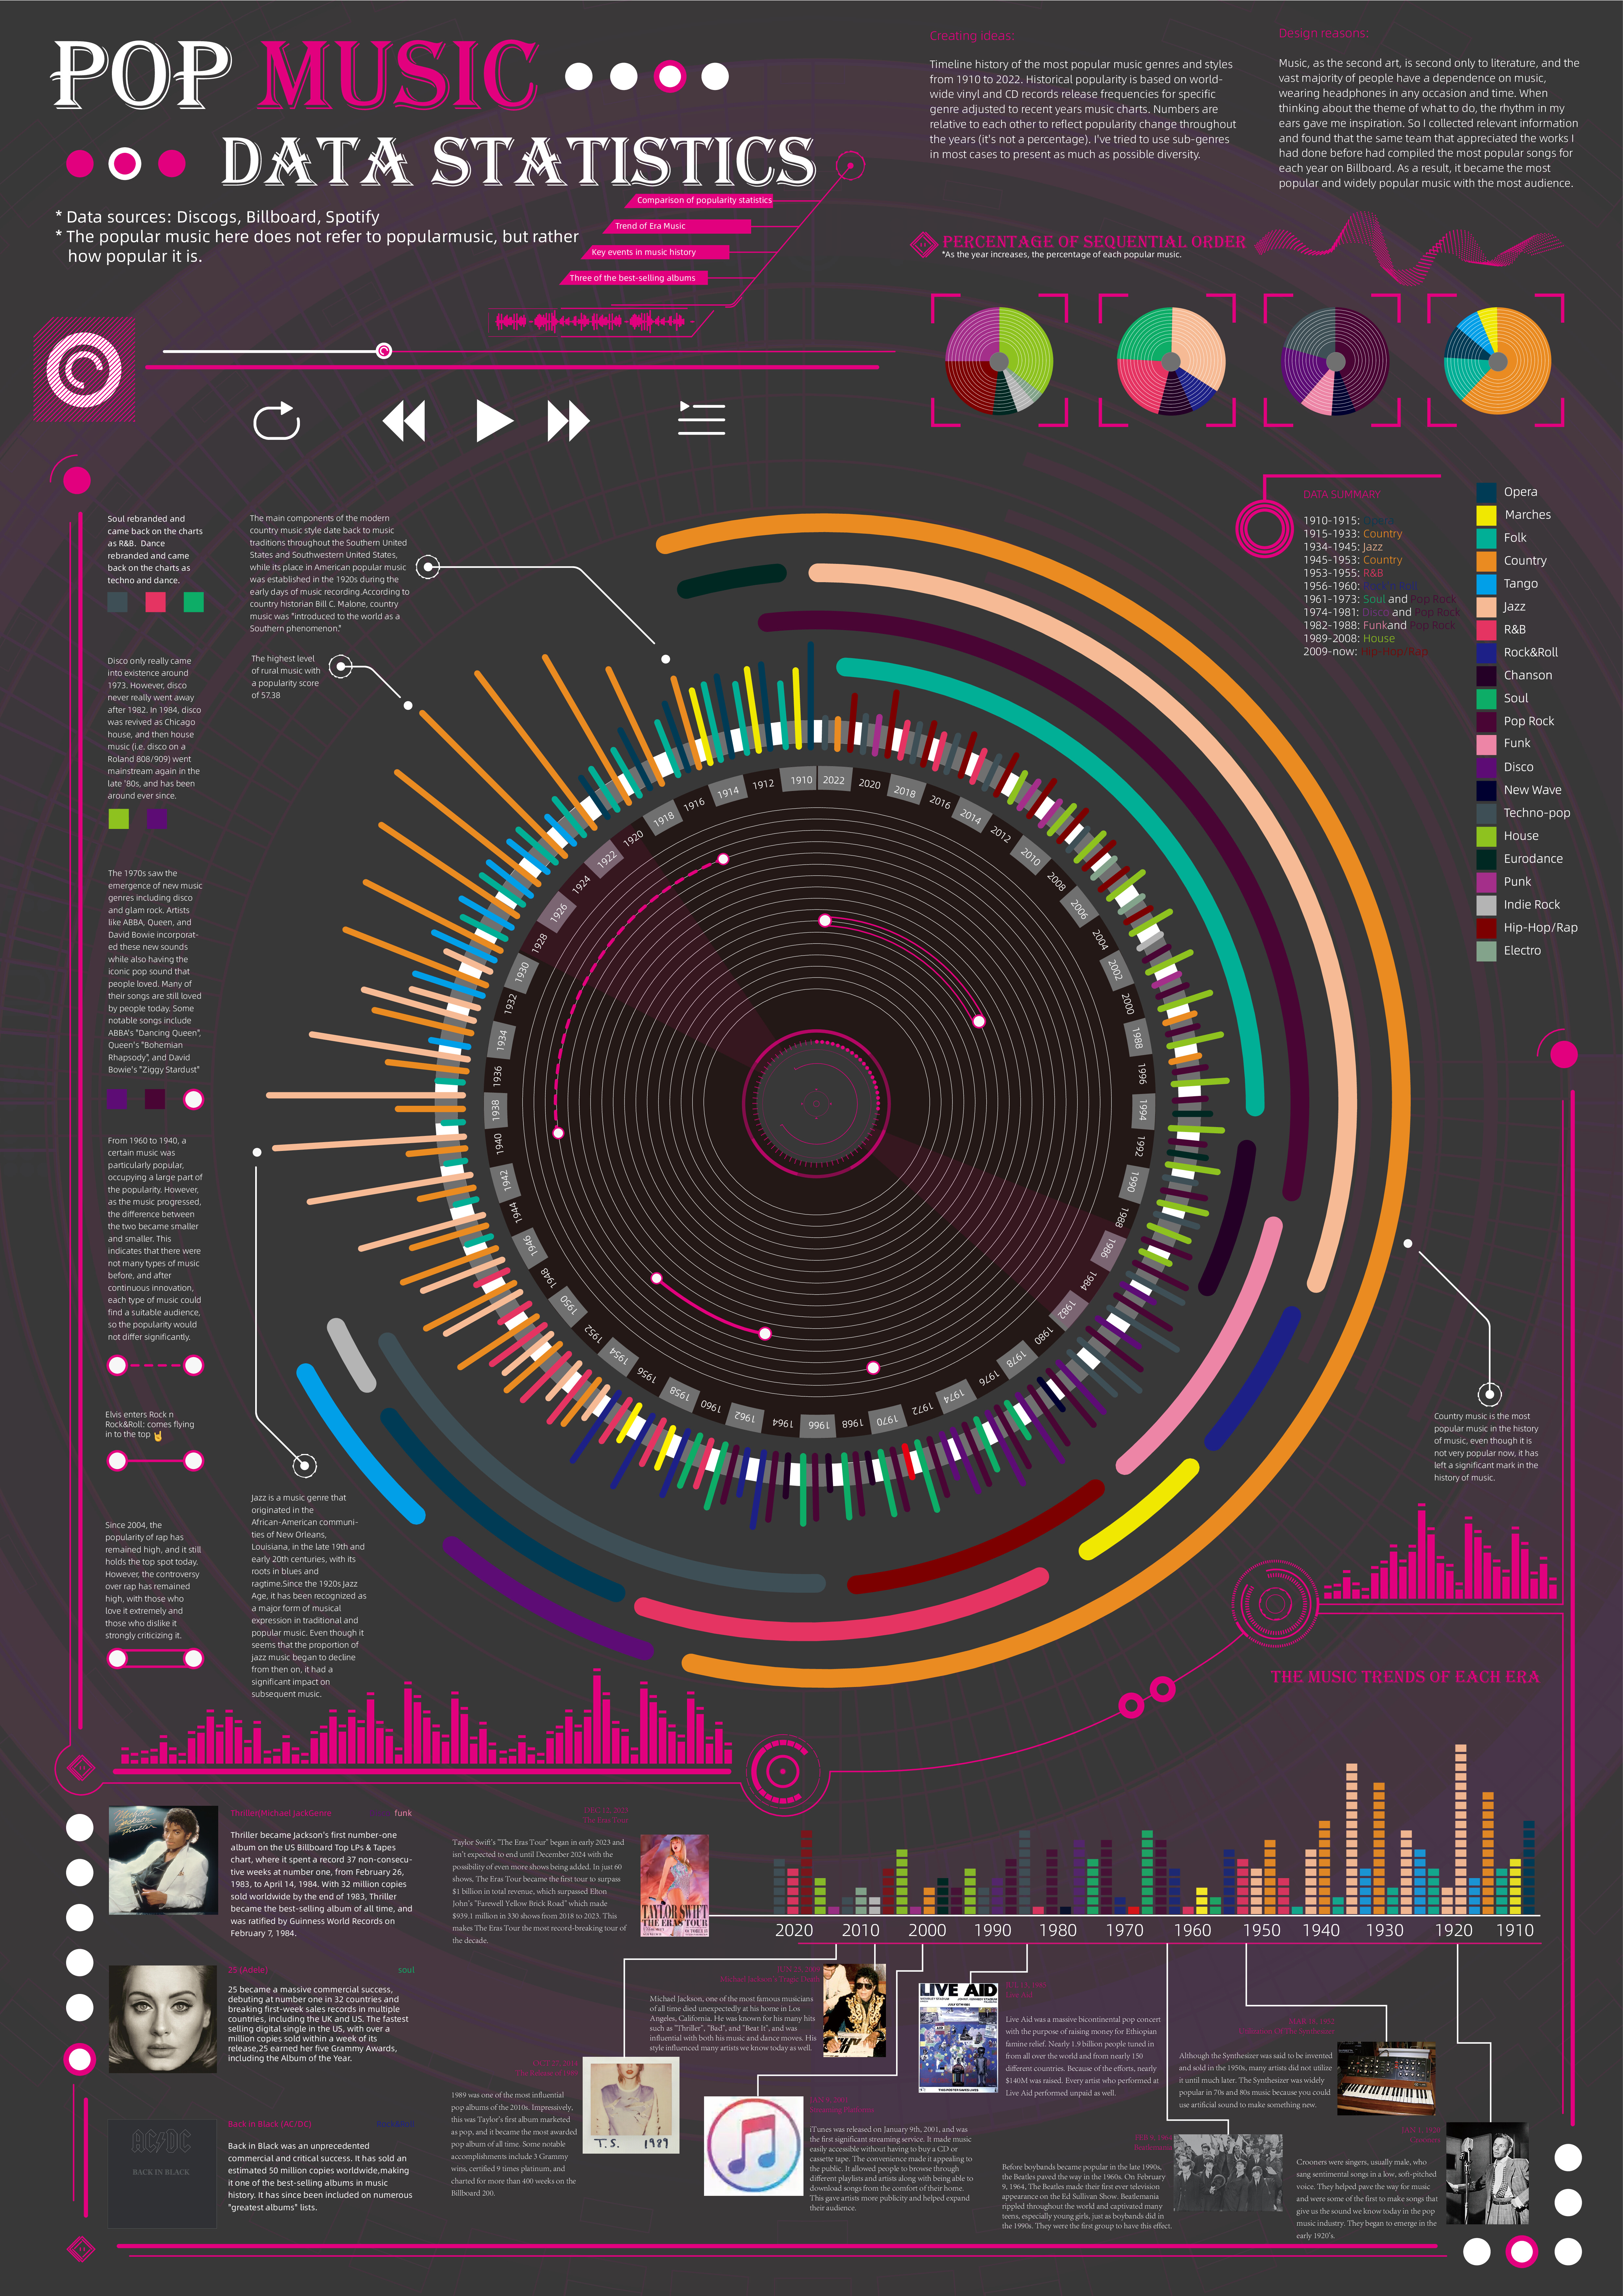
 View projectTimeline history of the most popular music genres and stylesfrom 1910 to 2022.Historical popularityis based on world-wide vinyl and CD records release frequencies for specificgenre adjusted to...
 -
 View project"Into the Movieverse" is an engaging data visualization project that explores cinematic statistics for films released between 1980 and 2022. Its intuitive design allows users to delve into various...
 -
 View projectWe take you through how we sifted nearly 350,000 candidates who stood for elections in India to find those that sounded…awkwardly similar to each other. Is it a coincidence that Raghul Gandhi...
 -
 View projectBlending the worlds of data and art, this visualisation explores how abstract design can hold meaning beyond aesthetics, showcasing the weather trends that shape Glastonbury, the world’s largest...
 -
 View projectThis visualization represents the character interaction network in Shakespeare’s Romeo and Juliet. Using #TidyTuesday data from the Web's first online edition of the Complete Works of William...
 -
 View projectTraditional "year in charts" retrospectives usually consist of rehashed newsroom graphics from the year gone. This project takes a fundamentally different approach. Instead of revisiting the key...
 -
 View projectThese infographics show the constellations of various countries around the world. The data used to create the maps draws on areas of artificial brightness, which occludes the visibility of stars in...
 -
 View projectI love space and science! This work was inspired by my own curiosity and love for space. It has such a cyclical magical feel that transcends our small blip of existence. You can see that with the...
 -
 View projectThis Visualisation provides Real-Time Analysis and Seasonal Trends for Optimized Solar Power Generation plants.
 -
 View projectSupported entirely through volunteers in the data viz community, Viz for Social Good endeavors to create informative and impactful data visualizations for mission-driven organizations globally. In...
 -
 View projectHow can you make the SDGs accessible to a broad audience and captivate 25,000 visitors? The answer: through compelling VISUALIZATION, an interactive GAME SHOW, and hands-on ENGAGEMENT. The SDG...
 -
 View projectO relatório "Panoramas de Marketing e Vendas 2024", produzido pela RD Station, é a maior e mais completa pesquisa de Marketing e Vendas do Brasil. Captamos dados dos profissionais e lideranças que...
 -
 View projectThis visualisation tracks my personal Strava activities of run, ride and weight trainingacross every day of 2024. Parameters of measurement include distance (miles), activity time (mins),...
 -
 View projectThis project was my final for Designing with Data at MICA. I played with concepts for creating 8” x 5” data flashcards of environmental information to inspire my own digital humanities research...
 -
 View projectThis work explores the predictive potential of plasma biomarkers, including GFAP, NEFL, and GDF15, in dementia diagnosis. By demonstrating their strong association with Alzheimer’s Disease,...
 -
 View projectThe Tour de France features a number of “races within the race” beyond the overall competition for the winner’s yellow jersey. There are other winner’s jerseys for the best young rider, the best...
 -
 View projectA comprehensive view and a practical guide to identify the 58 cloud forms listed by the World Meteorological Organization (WMO). This unique visualization shows not only the 58 cloud forms but...
 -
 View projectThere are for sure some bucket list items to design, one of mine is covered within the project: a classical Swiss «Bundesordner». Filled with a publication about the FIFA World Cup history, from...
 -
 View projectThis visualization showcases linear graphs for all pure spellcasters in D&D. It displays the maximum average spell damage per level and the corresponding dice rolled by the player. The graphs...
 -
 View projectThis video data visualization project presents a unique, abstract interpretation of a star’s life cycle, using dynamic visuals to explore its formation and evolution. The journey begins with a vast...
 -
 View projectThe National Statistics office of Mongolia conducts a Time Use Survey every four years. The Tungaahui Data Studio LLC worked on the latest 2023 survey data visualization and report design. Main...
 -
 View projectContext: When Trash Becomes Part of the Landscape In Panama City, waste management poses a daily challenge. While the landfill known as "Patacón" concentrates the majority of the city's waste,...
 -
 View project“Fortunes of War” combined data journalism and boots-on-the-ground reporting to expose allegations of deceptive behaviour by Australian pension funds. Our investigation painstakingly compiled...
 -
 View projectAssessing population well-being is as complex as it is sensitive, requiring careful consideration of various factors contributing to individuals’ quality of life. While established metrics such as...
 -
 View projectThe Data Designer is a mobile-first interactive survey developed by Munus Shih, Richard Lehmann, Allison Connell and Matt Owen of Athletics. It allows the user to create bespoke animated data...
