Spain lives in flats: why we have built our cities vertically by elDiario.es
"Spain lives in flats" is an innovative and interactive journalistic project by elDiario.es that analyzes the footprint of more than 12 million buildings to map the height of Spanish cities in 3D to analyze their sustainability and impact on the current urban society. The investigation that includes narrative visualizations shows why Spain is one of the countries in the world that has built the highest and most dense cities compared to other countries, two of every three Spaniards live in flats and apartments and only a third in single-family and semi-detached houses.
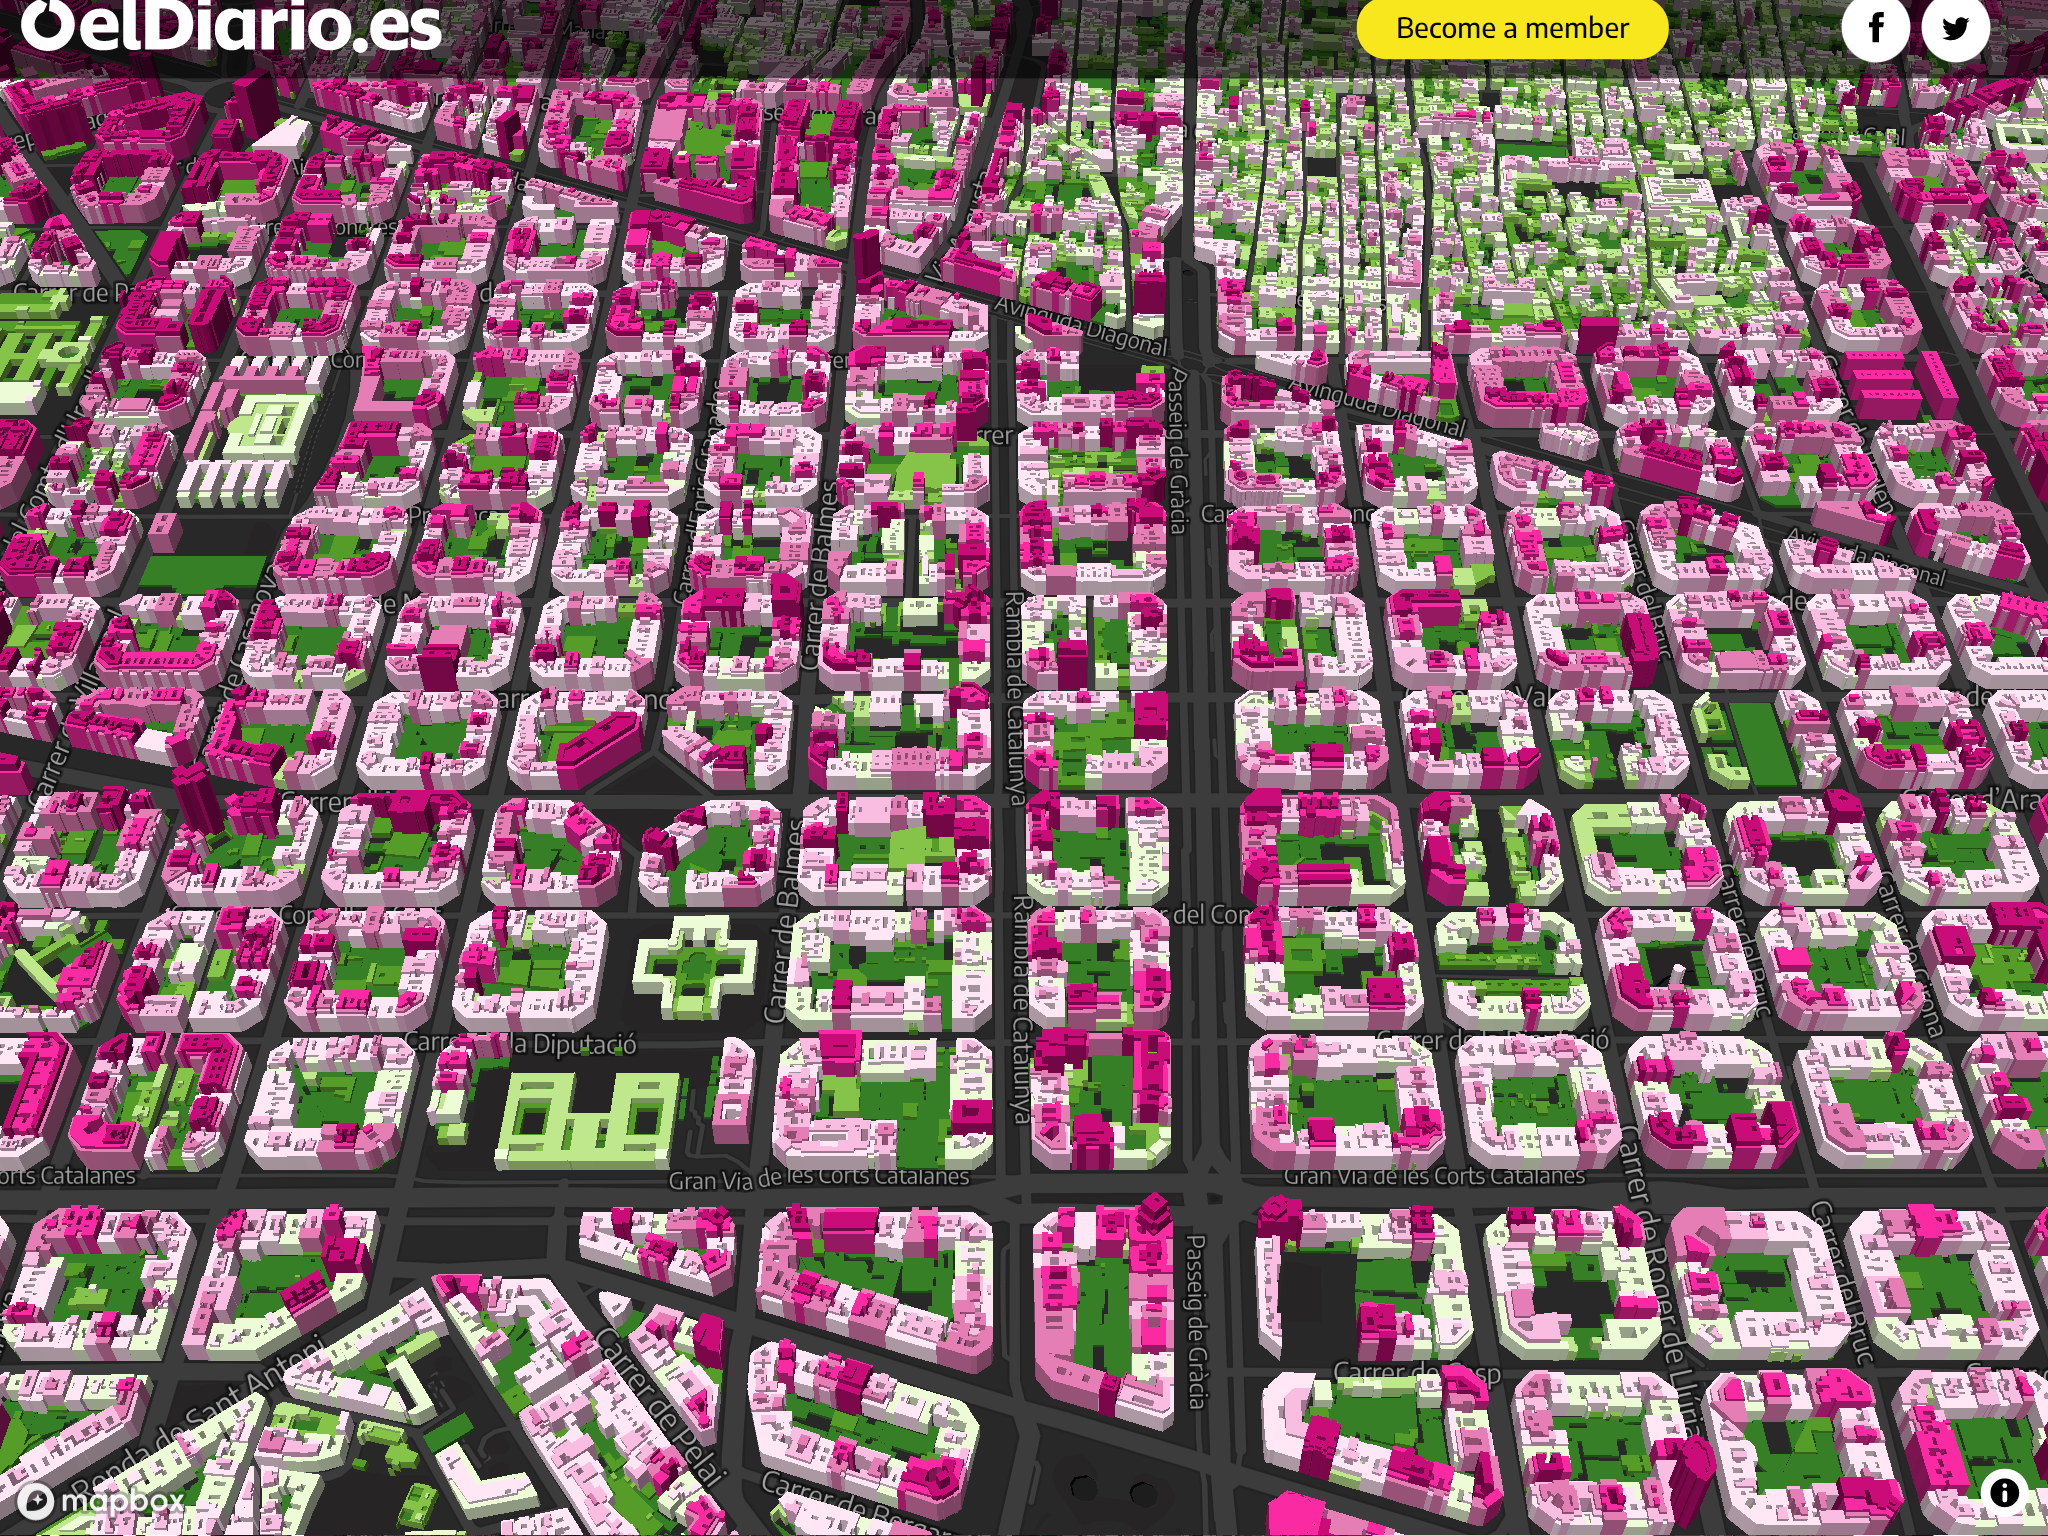
This project compiled for the first time in a single database the cartographic plans of all the buildings currently standing in the Spanish territory. The 3D map allows the users to understand the vertical urbanism that has characterized Spanish cities in the last century. The innovative format allows readers to explore the heights of their buildings in three dimensions together with graphics and data that explain the urban decisions and the socioeconomic context of each decade.Furthermore, the project used solutions journalism by explaining and proposing several sustainable models for the European cities of the future based on interviews with experts and the analysis of the mistakes and challenges of urban planning discovered in the historical data analyzed for the project.
The hardest part of the project was compiling and automating the download of the building footprint of more than 12 million buildings and processing that amount of information. We created an R script that downloaded cadastral data of the buildings of more than 7,600 municipalities, one by one. The total size of the downloaded files exceeded 200GB. During the processing of the data, the journalists found errors in the files that were later corrected after notifying the cadastral institution.
Then, we processed and joined in R all downloaded files to have a single database with the details of all the buildings in Spain. For example, we verified the data of 12 million buildings, we calculated the height of every building from the part that occupies the most built volume in the plans and we extracted the date of the building from the start of construction. All these processes were repeated several times during the year due to the publication of corrections and allowed us for the first time in Spain to have a database and a visualization with the heights of all the buildings in the country.
We used R, Rstudio, QGIS and Tippecanoe for data compilation, processing and analysis. We had to do a lot of tests to compress the geographic information as much as possible to be able to map it on all devices. D3.js and Javascript were used for data visualization. Mapbox for mapping building footprint. HTML, Javascript and Scrollama for scrolling webpage.
When considering the structure of the story, we conceived it as a journey from the small anecdote to the big phenomenon. For this reason, the piece begins by telling the story of a building in A Coruña and then explaining vertical urbanism in Spain. This story works as a historical journey through each urban model developed in Spain contextualized with graphics and details of each moment.
-
CreditsRaúl Sánchez, data journalist @raulsanchezglez Analía Plaza, reporter @lalalalia
-
Award
-
Categories
-
See more


