U.S. Daily Temperature Anomalies, 1964-2014 by Enigma
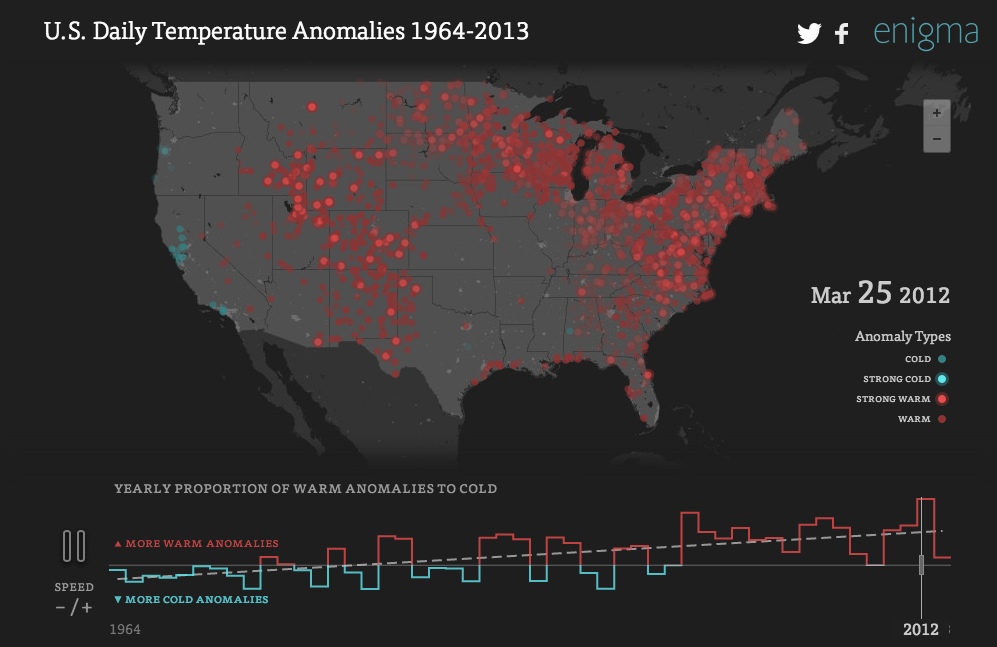
Every day, the Global Historical Climatology Network collects temperatures from 90,000 weather stations. Dating back as far as the late 1700's, the records provide an incredible source of insight into our changing climate. Using this data, the team at Enigma developed a novel method for detecting anomalous weather events by comparing daily readings from individual stations to their historical and seasonal distributions. These anomalous events were then presented in two formats: A HTML5 canvas map that animated all 50 years of anomalies, day-by-day, and a series of interactive charts to show the overall trend of increasing "warm" and "hot" anomalies.
-
CreditsDan Delany ([email protected]) Brian Abelson ([email protected]) Jeremy Krinsley ([email protected]) Hicham Oudghiri ([email protected]) Ken Keiter ([email protected])
-
Award
-
Categories
-
See more


