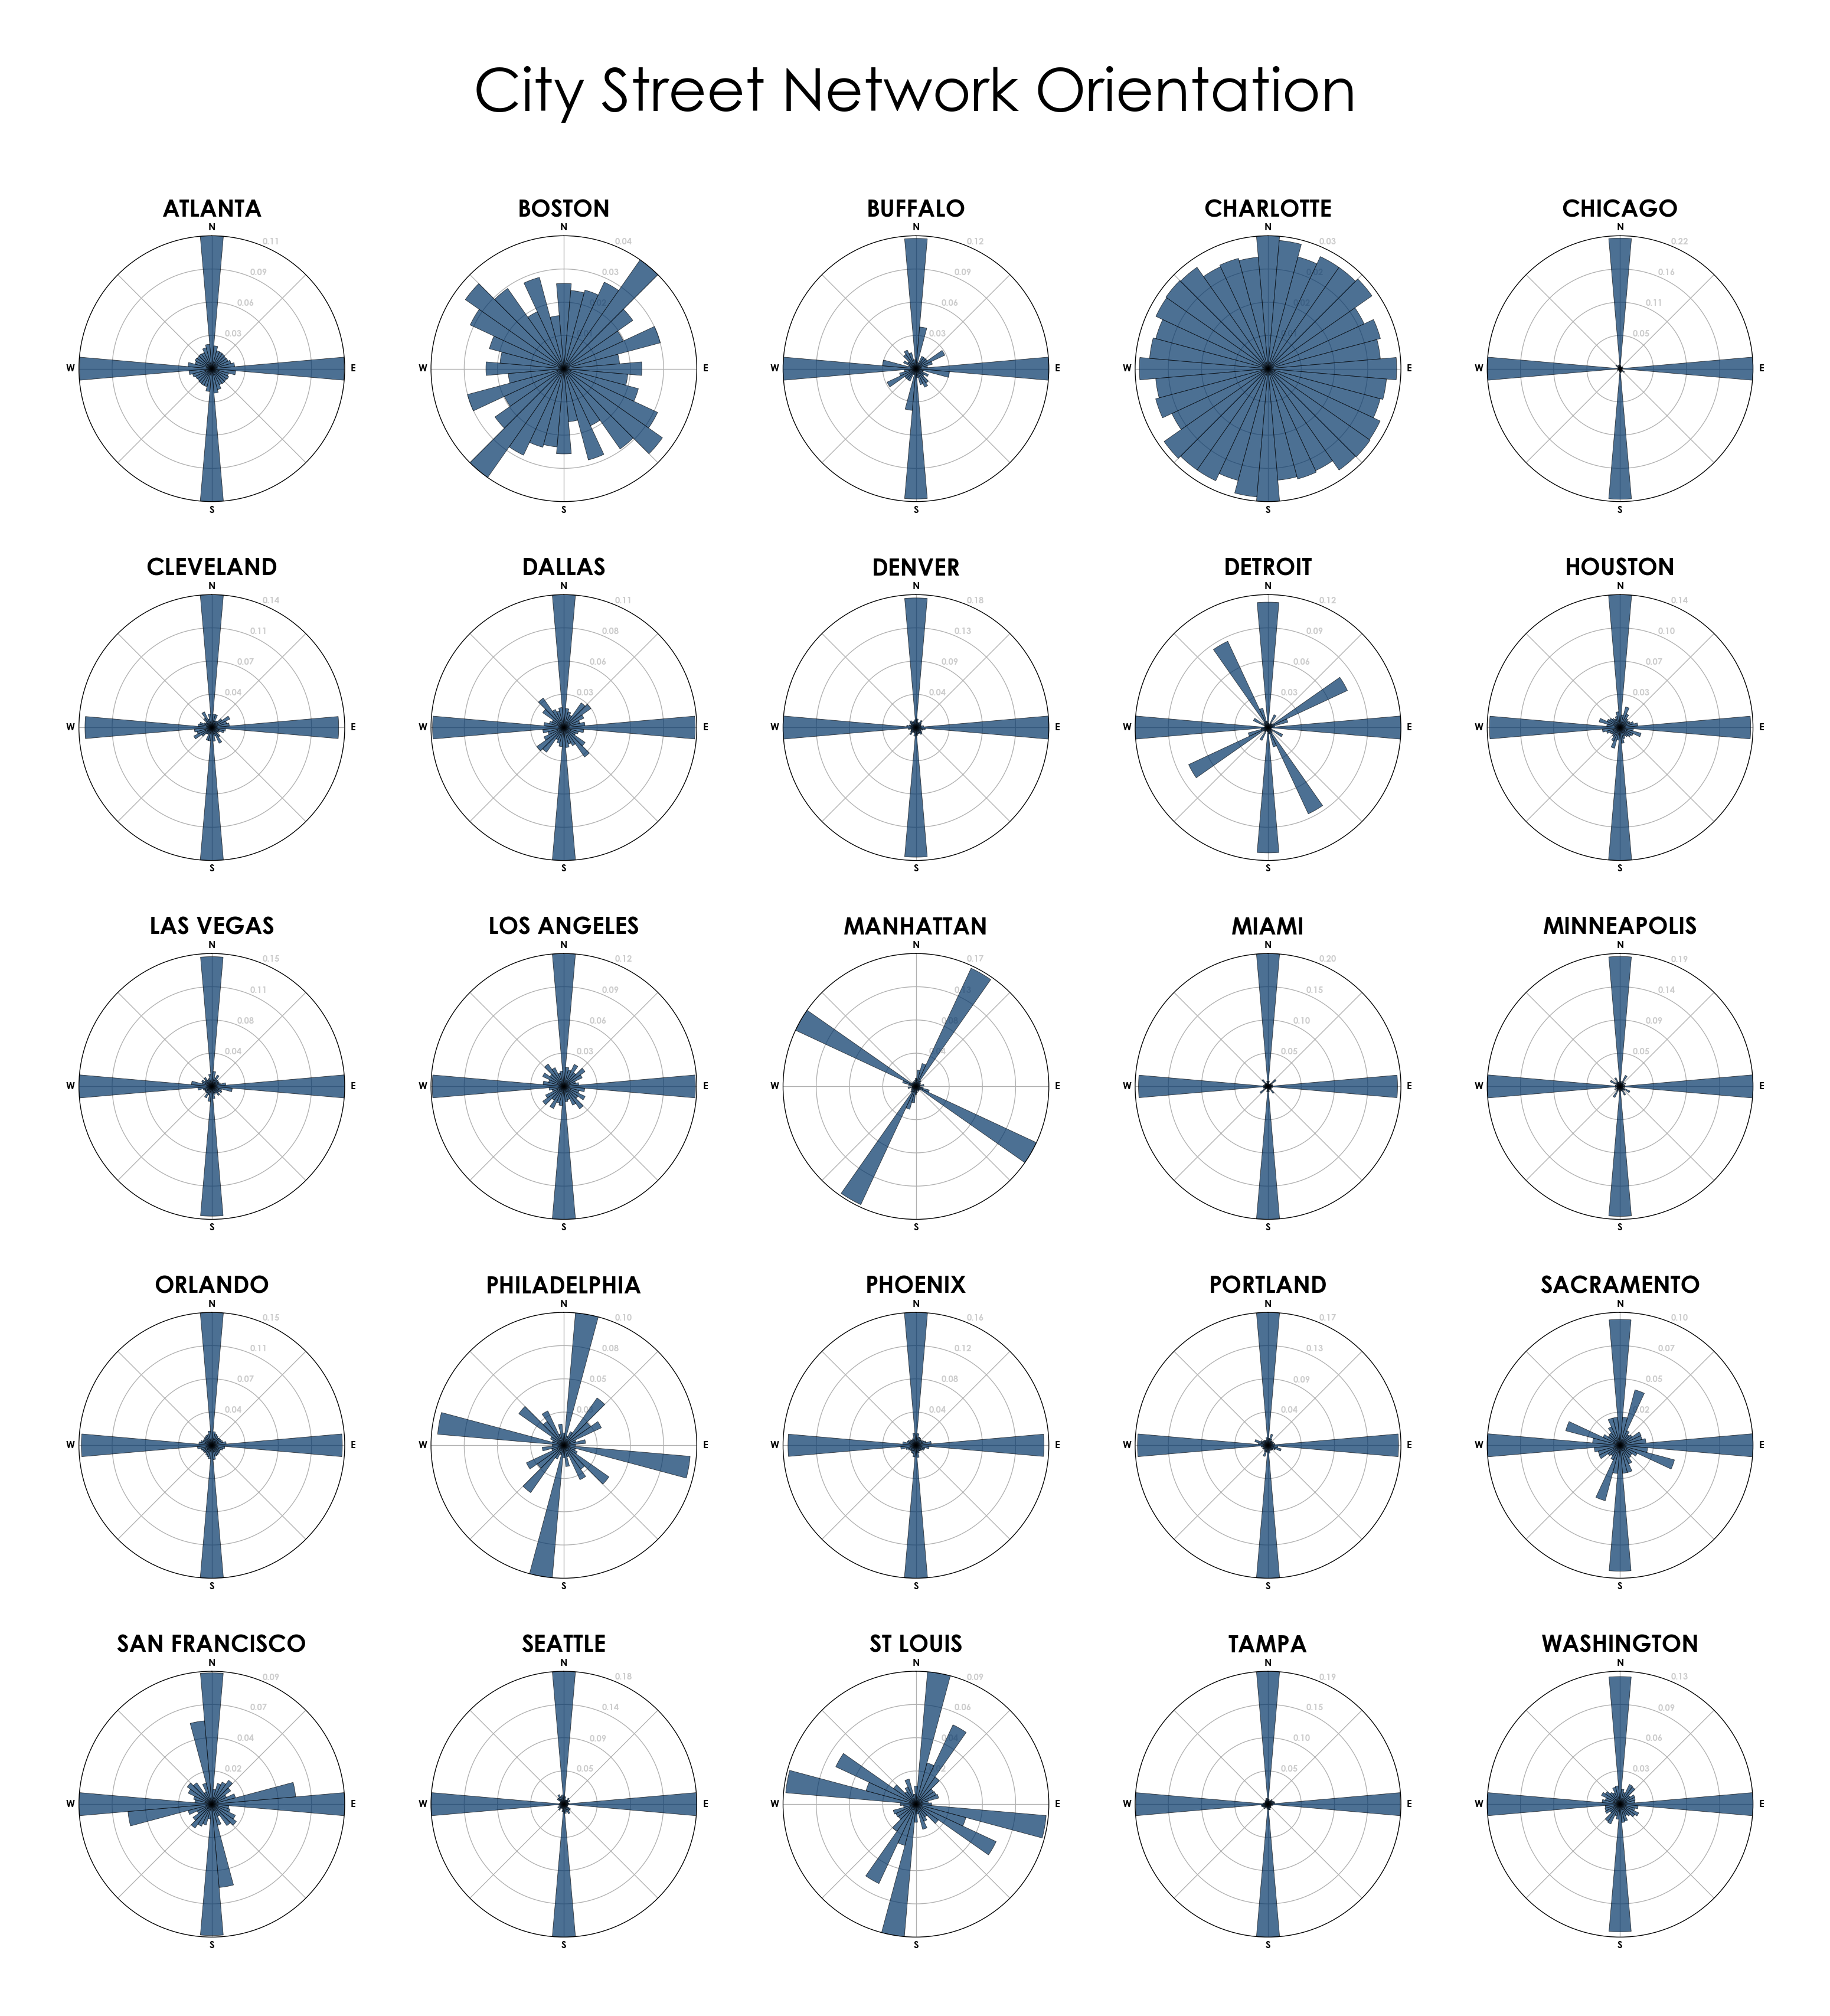
City Street Network Orientations Around the World by Geoff Boeing
This project visualizes city street network orientation, configuration, and entropy using OpenStreetMap data and the Python-based OSMnx package. Each of these cities is represented by a polar histogram depicting how its streets orient. Each bar's direction represents the compass bearings of the streets and its length represents the relative frequency of streets with those bearings. These visualizations include 1 image of 25 American cities sorted alphabetically, 1 image of 25 world cities sorted alphabetically, and 1 image of 100 world cities sorted by entropy (that is, sorted as the most-to-least ordered street networks).
-
CreditsGeoff Boeing
-
Award
-
Categories
-
See more


