Interactive Optimisation Time Saving Tool by David Murphy
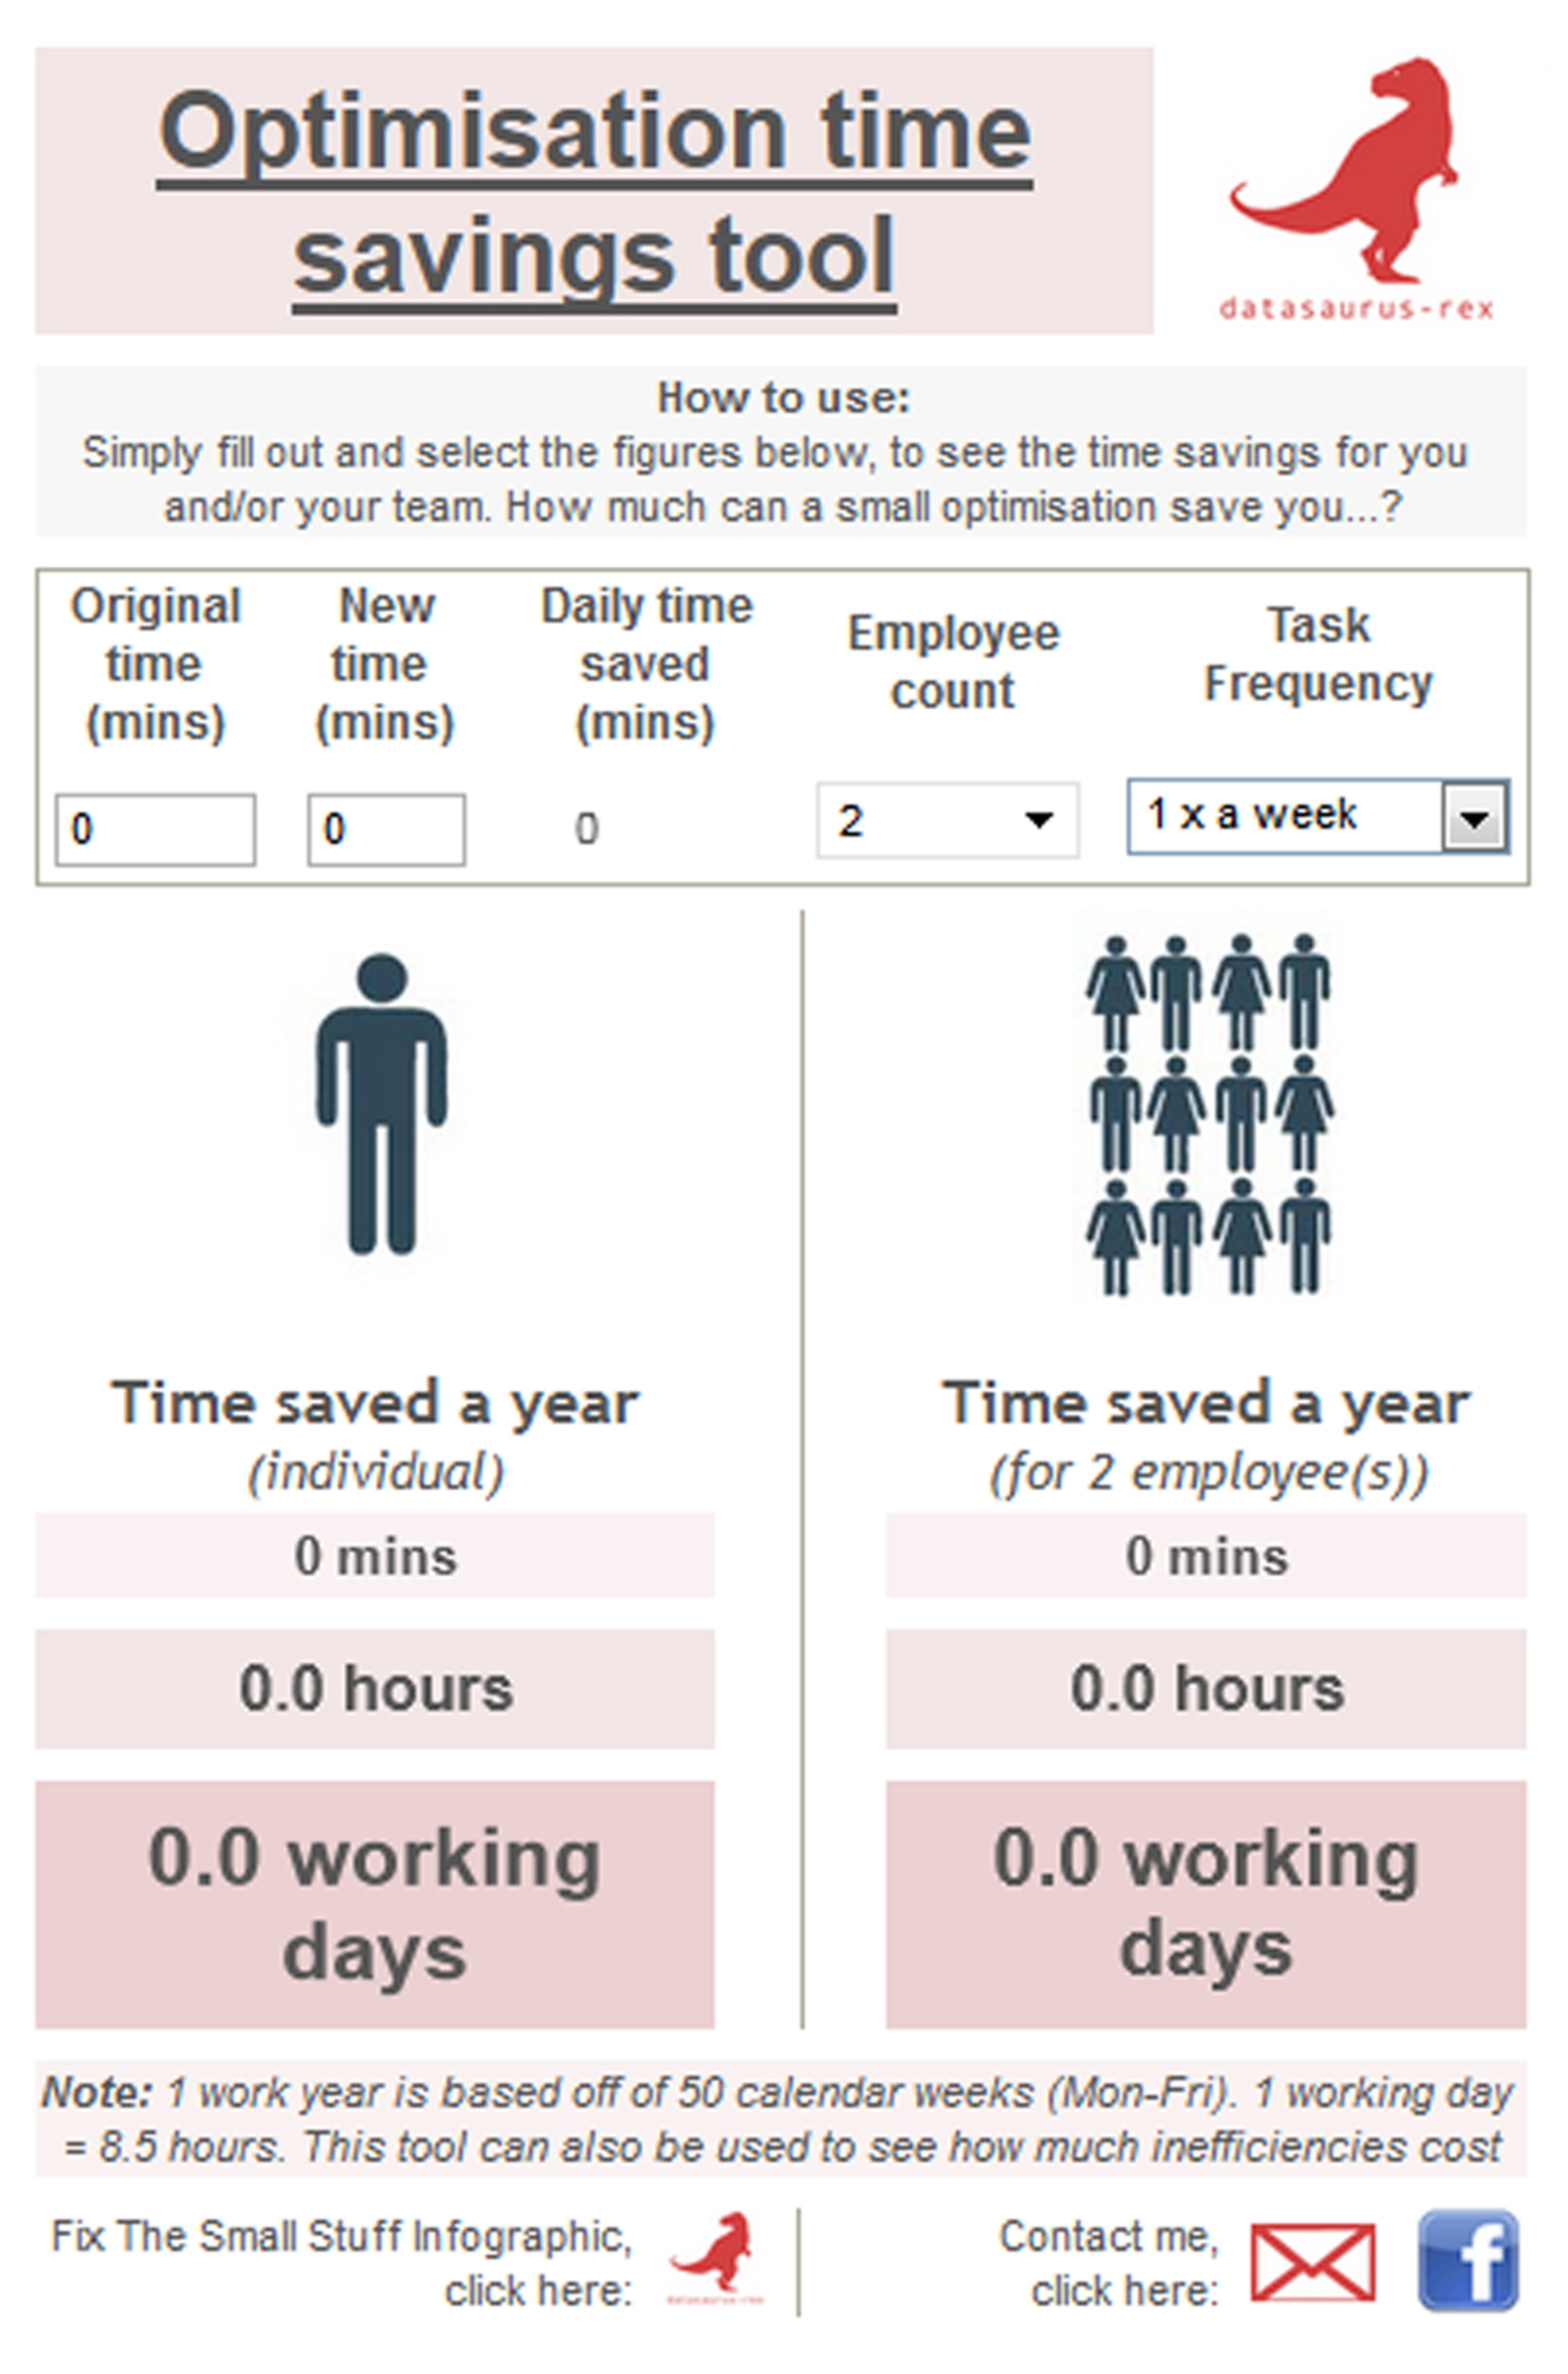
This interactive tool was created to help people work out how much time they could save if they found quicker ways of doing things in their life. I used Tableau Public in a way that it isn't usually used, in order to create this interactive infographic.
In work and personal life, many people slog away in time consuming tasks, never taking the time to step back and see if it can be done faster/better – reciting the mantra “but it only takes 5 minutes, why bother?”. This irks me, as those 5 minutes can add up to substantial losses of one's time, which could be better spent doing other things. Getting people to see this is tricky, so I built the tool to help people realise the wider impact these collective tiny task can create.
An interactive infographic only succeeds if it is used. Anything too complex and it will confuse and put off users from interacting with it. In order to increase its use, the effort by the user is streamlined, so they only have to enter in four inputs. They can then instantly see how much time they or their team could save in a neat and well-structured infographic (less is more for this use).
I also wanted to liberate the tool and make it more accessible, hence it's size dimensions. Harnessing Tableau Public's browser functionality, users can interactive with and create their own personalised infographic wherever they are on any device i.e. it works on smartphones, tablets and PCs. They can then take screenshots or use Tableau Public's inbuilt pdf/jpeg export functionality to save these personalised infographics.
I have successfully used this tool to win investment on spending the time automating reporting processes at my company – the infographic showed that a team of 4 could (and has) saved just over 200 working days a year due to this investment. Nearly a whole headcount!
Other users have reported similar success, when being presented with invest case support, or to push back on new processes by looking at the macro impact to them, their team or the company.
Related posts:
The post featuring the tool - http://datasaurus-rex.com/?p=297
“Fix the small stuff” post w/ infographic - http://datasaurus-rex.com/?p=98
-
CreditsDavid Murphy
-
Award
-
Categories
-
See more


