
Portrait of a population
Open data can empower citizens and spark debate.
That’s exactly what pioneers in open data, Rennes Metropolis, set out to do when they commissioned data visualization studio Dataveyes to create Qui Sommes Nous?
The web interactive transforms Rennes' census data into a user-friendly data visualization, allowing the city's inhabitants to learn about their local urban population.
Users start by entering their gender and age bracket to get an immediate sense of how well represented they are in their city.

They can then dig into the juicier details: what people their age and gender do for a living, the kind of houses they live in and the number of vehicles they own.
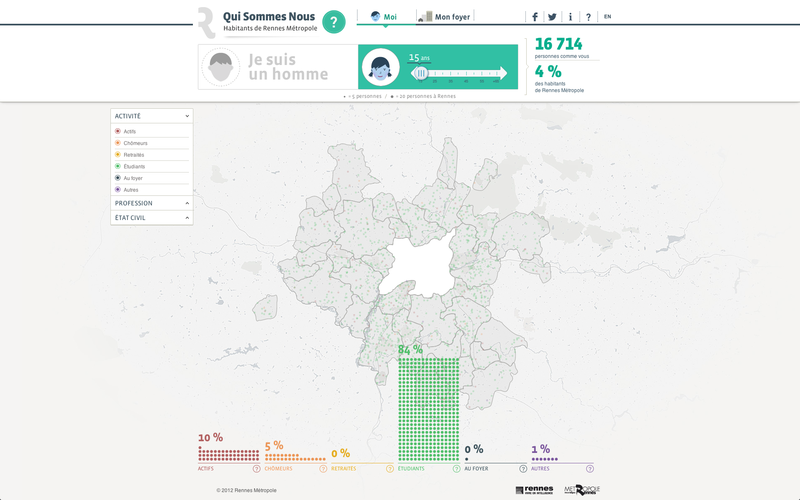
The viz aims to encourage local citizens to reflect on their sense of belonging to their urban community.
The team at Dataveyes were keen to ensure that they go beyond presenting raw information. At the risk of compromising neutrality, they sought to explain the meaning behind the census data and spark healthy, democratic debate. They even built in a mode for identifying districts where a particular demographic is over or under represented.
You can find out more about the project (and the talented team behind it) by visiting the Dataveyes website.

